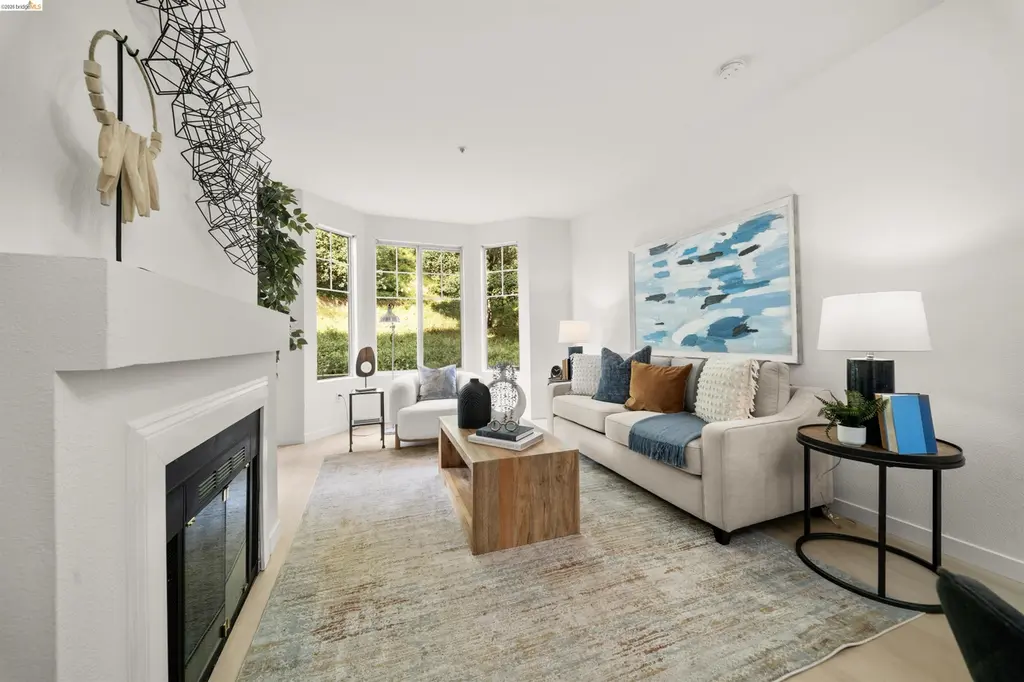
320 Caldecott #116
Oakland, CA 94618
$320,000D
1 bd · 1.0 ba ·
728 sqft ·
Built 1998
· Condo
· Pending
· 20 DOM
Cashflow @ list (25.0% down · 7.5%)
Estimated rent
$3,526/mo
Mortgage (P&I)
−$1,678
Tax + insurance
−$836
HOA
−$847
Vac / Maint / Mgmt
−$740
Net cashflow
$-576/mo
Annual
$-6,907/yr
Cap rate
4.38%
Cash-on-cash
-6.82%
DSCR
0.70
1% rule
1.10%
Cash to close
$89,600
Investor read
- This is a 1-bed/1.0-bath condo listed at $320k.
- At list price, monthly cash flow is $-576 ($-7k/yr) — negative.
- To cash-flow at today's rent, offer at most $218k (31.8% below list).
- Meets the 1% rule at list price ($4k rent vs $320k).
- It's been on market 20 days — a 2% lower offer ($315k) is reasonable based on typical stale-listing flexibility.
- Recommended offer: $218k (31.8% below list) — sets the bar for cash-flow.
- Local home prices are declining (-3.0%/yr); year-one equity from $2k of loan paydown is wiped out by about $10k of value loss. Plan a longer hold.
- Location reads 71/100 on livability (#224 in CA) — a middle-class / working-renter tenant base. Strengths: amenities A+, commute A+, employment A+; Watch: crime F, cost of living F.
- Oakland Unified (urban): math 27% / reading 33% proficiency, ranked #1,007 of 1,400 in CA (top 72%) — families likely to look elsewhere, expect single-tenant / working-renter base with shorter leases; 68% free/reduced lunch — lower-income household profile, screen leases tightly.
- Zoned schools: Claremont Middle (487 students, 43% FRL); Oakland Technical High (1,796 students, 57% FRL) — zoned schools average 50% FRL vs 68% district-wide (18 pts lower); this property's tenant base skews higher-income than the district average.
- Watch-outs: flood insurance adds $66/mo; HOA is 24% of rent.
- Market conditions: Rents rising fast (+5.7%/yr); 53 active listings in the ZIP; 2 comparable units currently listed for rent nearby; high-income renter base; 1,742 units permitted in Alameda County in 2024 (856 in 5+ unit buildings).
- Alameda County population projected at +34% by 2050 — long-run rental-demand tailwind backs the buy-and-hold thesis.
- 3 sale attempts since 19y ago with the ask held roughly flat each time — persistent listings suggest the price (not the market) is what's stuck; bring a comps-based counter.
- Climate carrying-cost: severe flood risk — expect insurance premiums to compound above CPI over the hold.
- Cap rate 4.4% vs local median 2.5% in Oakland — top-decile yield for the area; either an underpriced asset or a hidden risk that comps aren't pricing in. Stress-test before assuming the spread holds.
Questions for listing agent
- What do current leases actually rent for vs. the listed asking? Can we see a recent rent roll and the last 12 months of T-12 income?
- What's the actual annual flood-insurance premium (NFIP or private), and is the property in a SFHA with mandatory coverage?
- What does the HOA fee cover, when was the last increase, and are there any pending special assessments or reserve-fund shortfalls?
- Any open or pending special assessments — roof, HVAC, plumbing, elevator, façade? What's the per-unit balance and payoff schedule, and is the seller paying it off at close or rolling it to the buyer?
- Is there a deadline driving the sale (1031 exchange, divorce, estate, relocation)? That informs how much negotiation room exists.
- Crime grade is F in this area — have there been break-ins, vandalism, or insurance claims at this property in the last 3 years? What carrier currently insures it and at what premium?
- The area grade is low — what's the realistic commute time and amenity access for the typical tenant pool here? Any planned neighborhood developments (good or bad) we should know about?
- What's the average days-on-market for RENTAL listings here right now (not sales)? A rising rental-DOM trend means longer vacancies and softer asking-rent achievability than the comps imply.
CashFlowRE · CFR-V129KC4W1ARVSX
· Data 4 days ago
cashflowre.app · 2026-05-29