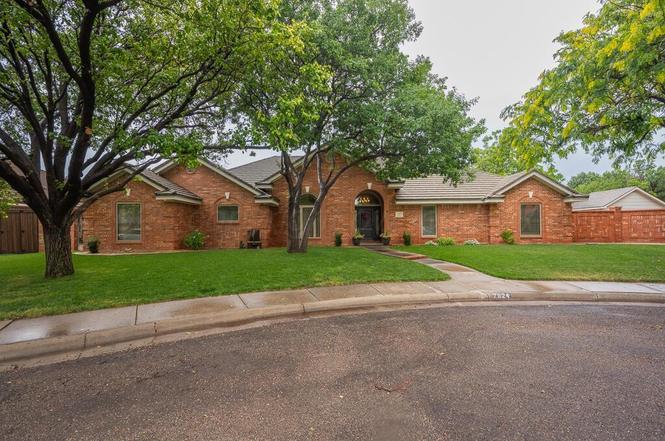
7824 Tarrytown Ave
Amarillo, TX 79121
$569,000D+
4 bd · 3.0 ba ·
3,153 sqft ·
Built 1990
· SingleFamily
· Pending
· 21 DOM
Cashflow @ list (25.0% down · 7.5%)
Estimated rent
$5,595/mo
Mortgage (P&I)
−$2,984
Tax + insurance
−$1,069
HOA
−$0
Vac / Maint / Mgmt
−$1,175
Net cashflow
$367/mo
Annual
$4,407/yr
Cap rate
7.07%
Cash-on-cash
2.77%
DSCR
1.12
1% rule
0.98%
Cash to close
$159,320
Investor read
- This is a 4-bed/3.0-bath single-family listed at $569k.
- At list price, monthly cash flow is $367 ($4k/yr) — positive.
- The deal already cash-flows at list — no discount required.
- To meet the 1% rule (rent ≥ 1% of price), the offer needs to be $560k (1.7% below list).
- It's been on market 21 days — a 2% lower offer ($560k) is reasonable based on typical stale-listing flexibility.
- Recommended offer: $560k (1.7% below list) — sets the bar for 1% rule.
- Local home prices are declining (-3.0%/yr); year-one equity from $4k of loan paydown is wiped out by about $17k of value loss. Plan a longer hold.
- Location reads 66/100 on livability (#624 in TX) — a middle-class / working-renter tenant base. Strengths: cost of living A+, housing A+; Watch: amenities C-, crime F, commute F.
- Amarillo ISD (urban): math 44% / reading 41% proficiency, ranked #336 of 826 in TX (top 41%) — families likely to look elsewhere, expect single-tenant / working-renter base with shorter leases.
- Zoned schools: Sleepy Hollow El (math 72% / reading 66%, grade A-, #168 of 4,322 statewide, top 4%, 517 students, 31% FRL); Bonham Middle (math 61% / reading 49%, grade B-, #248 of 1,662 statewide, top 15%, 867 students, 37% FRL); Amarillo H S (math 55% / reading 64%, grade C+, #275 of 1,632 statewide, top 19%, 2,170 students, 34% FRL) — zoned schools average 34% FRL vs 58% district-wide (24 pts lower); this property's tenant base skews higher-income than the district average.
- Zoned-school proficiency averages 61% at this address vs 42% district-wide (+19 pts) — the actual schools serving this property are materially stronger than the Amarillo ISD average implies; a family-tenant draw the district grade alone would hide.
- Market conditions: 39 active listings in the ZIP; 1 comparable units currently listed for rent nearby; 45 units permitted in Randall County in 2024 (0 in 5+ unit buildings).
- Randall County population projected at +36% by 2050 — long-run rental-demand tailwind backs the buy-and-hold thesis.
- 2 sale attempts since 9y ago with the ask held roughly flat each time — persistent listings suggest the price (not the market) is what's stuck; bring a comps-based counter.
Questions for listing agent
- Is there a deadline driving the sale (1031 exchange, divorce, estate, relocation)? That informs how much negotiation room exists.
- Schools are D-rated, which usually means shorter tenancies and higher turnover. Who's the typical renter profile here, and what's been the actual vacancy rate?
- Crime grade is F in this area — have there been break-ins, vandalism, or insurance claims at this property in the last 3 years? What carrier currently insures it and at what premium?
- The area grade is low — what's the realistic commute time and amenity access for the typical tenant pool here? Any planned neighborhood developments (good or bad) we should know about?
- What's the average days-on-market for RENTAL listings here right now (not sales)? A rising rental-DOM trend means longer vacancies and softer asking-rent achievability than the comps imply.
- What's the recent tenant-quality profile in this submarket — average credit score on applications, eviction rate, late-payment / NSF rate, and stable-employment percentage? A property-management company in the area should have these aggregated.
- How much new for-sale + rental construction is in the pipeline within 1–3 miles? Heavy new supply typically softens prices + rents 12–24 months out; constrained supply supports both.
CashFlowRE · CFR-V17R7BEMGPHTTJ
· Data 2 days ago
cashflowre.app · 2026-05-29