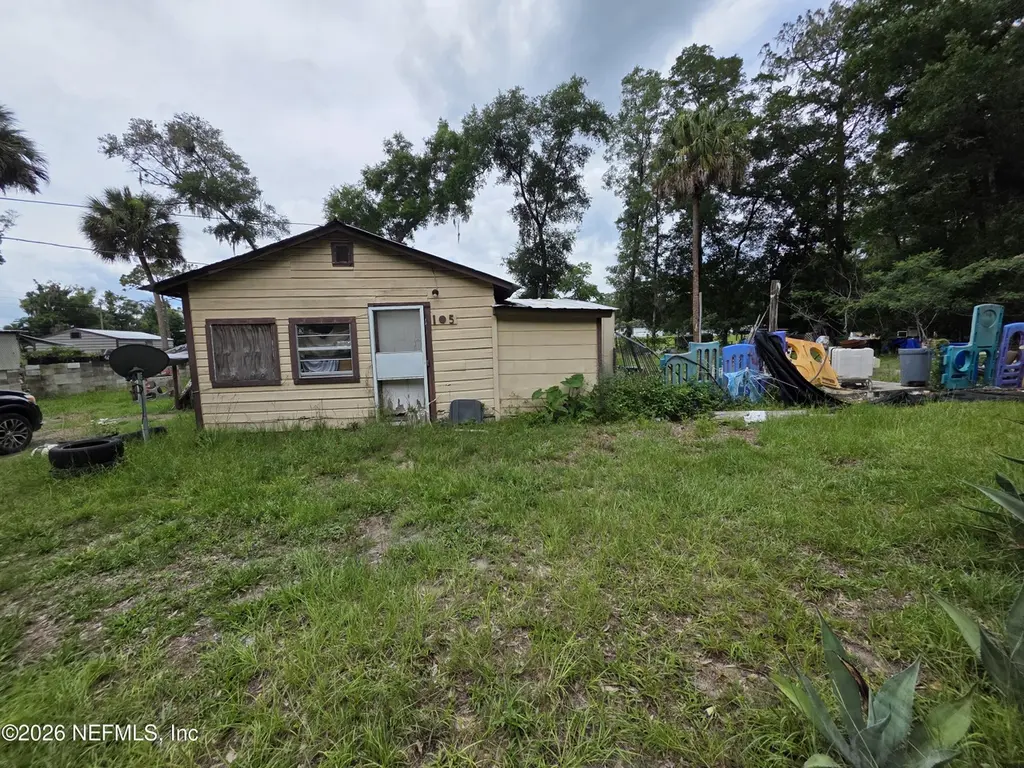
105 Brooks St
Pomona Park, FL 32181
$39,900B
2 bd · 1.0 ba ·
683 sqft ·
Built 1929
· SingleFamily
· Pending
· 1 DOM
Cashflow @ list (25.0% down · 7.5%)
Estimated rent
$846/mo
Mortgage (P&I)
−$209
Tax + insurance
−$46
HOA
−$0
Vac / Maint / Mgmt
−$178
Net cashflow
$413/mo
Annual
$4,958/yr
Cap rate
18.72%
Cash-on-cash
44.38%
DSCR
2.97
1% rule
2.12%
Cash to close
$11,172
Investor read
- This is a 2-bed/1.0-bath single-family listed at $40k.
- At list price, monthly cash flow is $413 ($5k/yr) — positive.
- The deal already cash-flows at list — no discount required.
- Meets the 1% rule at list price ($846 rent vs $40k).
- Only 1 days on market — expect competitive offers; lowballing is unlikely to land.
- In year one you build about $793 of equity ($276 loan paydown + $517 appreciation (1.3% local appreciation)).
- Location reads 61/100 on livability (#774 in FL) — a middle-class / working-renter tenant base. Strengths: crime A+, cost of living A+, housing A+; Watch: health & safety C-, schools F, amenities F.
- Putnam (town): math 34% / reading 39% proficiency, ranked #66 of 73 in FL (top 90%) — families likely to look elsewhere, expect single-tenant / working-renter base with shorter leases; 71% free/reduced lunch — lower-income household profile, screen leases tightly.
- Watch-outs: built in 1929 — expect roof / HVAC / electrical / plumbing capex.
- Market conditions: 72 active listings in the ZIP; 113 units permitted in Putnam County in 2024 (0 in 5+ unit buildings).
- Putnam County population projected at -31% by 2050 — secular population decline; favor cash flow + early exit over multi-decade hold.
- Current owner paid $10k; list at $40k implies a 299% gain — meaningful room to come down on a strong offer.
- At projected returns (1.3% appreciation + 3.0% rent growth), your $11k cash investment doubles in ~2 years — after that, you're playing with house money.
- Climate carrying-cost: severe wind risk, 99% chance of damaging wind over 30y; major wildfire risk; extreme-heat days projected 7→21/yr by 2055 (HVAC capex compounding) — expect insurance premiums to compound above CPI over the hold.
- Cap rate 18.7% vs local median 2.0% in Pomona Park — top-decile yield for the area; either an underpriced asset or a hidden risk that comps aren't pricing in. Stress-test before assuming the spread holds.
Questions for listing agent
- Built in 1929 — when were the roof, HVAC, electrical panel, plumbing, and water heater last replaced?
- Is there a deadline driving the sale (1031 exchange, divorce, estate, relocation)? That informs how much negotiation room exists.
- Schools are F-rated, which usually means shorter tenancies and higher turnover. Who's the typical renter profile here, and what's been the actual vacancy rate?
- What's the average days-on-market for RENTAL listings here right now (not sales)? A rising rental-DOM trend means longer vacancies and softer asking-rent achievability than the comps imply.
- What's the recent tenant-quality profile in this submarket — average credit score on applications, eviction rate, late-payment / NSF rate, and stable-employment percentage? A property-management company in the area should have these aggregated.
- How much new for-sale + rental construction is in the pipeline within 1–3 miles? Heavy new supply typically softens prices + rents 12–24 months out; constrained supply supports both.
CashFlowRE · CFR-V2MFEC9RY0WJ06
· Data 1 week ago
cashflowre.app · 2026-05-29