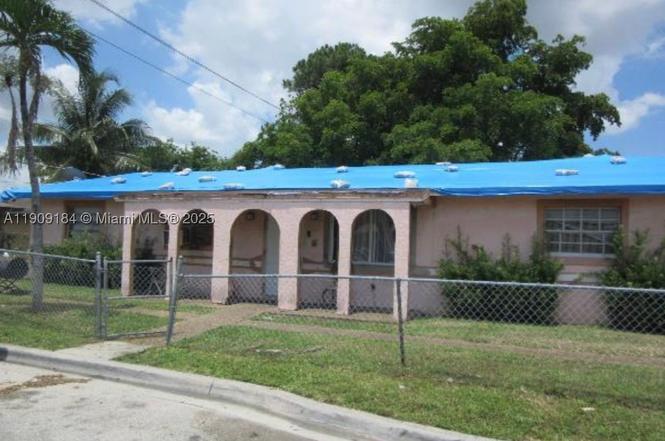
2800 NW 9th Pl
Washington Park, FL 33311
$215,000B
4 bd · 2.0 ba ·
1,595 sqft ·
Built 1977
· SingleFamily
· Pending
· 11 DOM
Cashflow @ list (25.0% down · 7.5%)
Estimated rent
$3,213/mo
Mortgage (P&I)
−$1,127
Tax + insurance
−$557
HOA
−$0
Vac / Maint / Mgmt
−$675
Net cashflow
$854/mo
Annual
$10,248/yr
Cap rate
11.06%
Cash-on-cash
17.02%
DSCR
1.76
1% rule
1.49%
Cash to close
$60,200
Investor read
- This is a 4-bed/2.0-bath single-family listed at $215k.
- At list price, monthly cash flow is $854 ($10k/yr) — positive.
- The deal already cash-flows at list — no discount required.
- Meets the 1% rule at list price ($3k rent vs $215k).
- Only 11 days on market — expect competitive offers; lowballing is unlikely to land.
- Local home prices are declining (-3.0%/yr); year-one equity from $1k of loan paydown is wiped out by about $6k of value loss. Plan a longer hold.
- Location reads 78/100 on livability (#164 in FL, #2,458 nationally) — a middle-class / working-renter tenant base. Strengths: crime A+, health & safety A+, commute A-; Watch: amenities F, employment F.
- Broward (suburban): math 42% / reading 53% proficiency, ranked #46 of 73 in FL (top 63%) — families likely to look elsewhere, expect single-tenant / working-renter base with shorter leases.
- Watch-outs: property tax is 2.6% of price.
- Market conditions: Rents rising (+2.8%/yr); 585 active listings in the ZIP; 40 comparable units currently listed for rent nearby; rentals at typical pace (median 25d on market — plan ~3-4 weeks tenant-placement turnaround); 2,111 units permitted in Broward County in 2024 (1,265 in 5+ unit buildings).
- Broward County population projected at +34% by 2050 — long-run rental-demand tailwind backs the buy-and-hold thesis.
- 2 sale attempts; this cycle's ask is 900% above the opening price — seller raised mid-cycle; expect resistance to lowballs.
- At projected returns (-3.0% appreciation + 2.8% rent growth), your $60k cash investment doubles in ~8 years — after that, you're playing with house money.
- Climate carrying-cost: severe wind risk, 99% chance of damaging wind over 30y; extreme-heat days projected 7→27/yr by 2055 (HVAC capex compounding) — expect insurance premiums to compound above CPI over the hold.
- At $3,213/mo this rent would consume 71% of the median local household income ($54k/yr) (locally 5068% of renters already pay >50% of income on rent) — very limited rent-growth headroom before tenants either downsize or default.
Questions for listing agent
- Built in 1977 — when were the roof, HVAC, electrical panel, plumbing, and water heater last replaced?
- Property tax is high relative to price — has the assessment been appealed recently, and will the sale trigger a re-assessment?
- Is there a deadline driving the sale (1031 exchange, divorce, estate, relocation)? That informs how much negotiation room exists.
- Schools are B-rated — typically a magnet for longer-tenancy family renters. What's the average tenant stay here, and is there a school-zone premium baked into asking?
- What's the average days-on-market for RENTAL listings here right now (not sales)? A rising rental-DOM trend means longer vacancies and softer asking-rent achievability than the comps imply.
- What's the recent tenant-quality profile in this submarket — average credit score on applications, eviction rate, late-payment / NSF rate, and stable-employment percentage? A property-management company in the area should have these aggregated.
- How much new for-sale + rental construction is in the pipeline within 1–3 miles? Heavy new supply typically softens prices + rents 12–24 months out; constrained supply supports both.
CashFlowRE · CFR-V3Q8AP01BMD31F
· Data 3 weeks ago
cashflowre.app · 2026-05-29