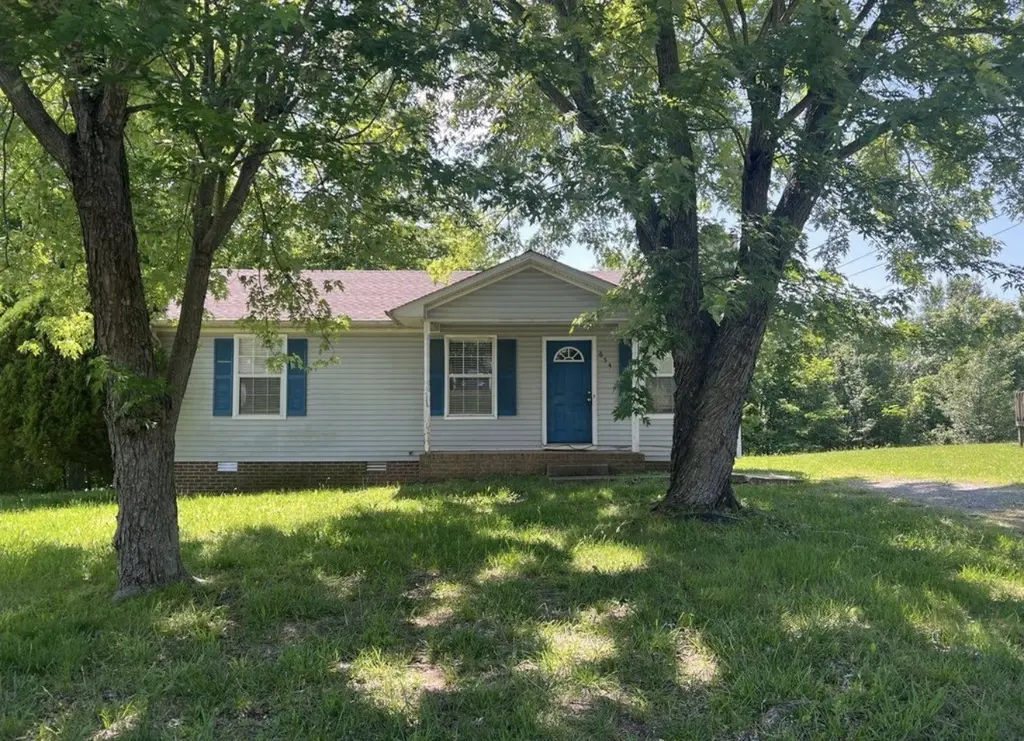
654 Artic Ave
Oak Grove, KY 42262
$145,900C
3 bd · 1.0 ba ·
875 sqft ·
Built 1993
· SingleFamily
· Active
· 76 DOM
Cashflow @ list (25.0% down · 7.5%)
Estimated rent
$1,215/mo
Mortgage (P&I)
−$765
Tax + insurance
−$117
HOA
−$0
Vac / Maint / Mgmt
−$255
Net cashflow
$77/mo
Annual
$930/yr
Cap rate
6.93%
Cash-on-cash
2.28%
DSCR
1.10
1% rule
0.83%
Cash to close
$40,852
Investor read
- This is a 3-bed/1.0-bath single-family listed at $146k.
- At list price, monthly cash flow is $77 ($930/yr) — positive.
- The deal already cash-flows at list — no discount required.
- To meet the 1% rule (rent ≥ 1% of price), the offer needs to be $121k (16.7% below list).
- It's been on market 76 days — a 6% lower offer ($137k) is reasonable based on typical stale-listing flexibility.
- Recommended offer: $121k (16.7% below list) — sets the bar for 1% rule.
- In year one you build about $2k of equity ($1k loan paydown + $1k appreciation (0.9% local appreciation)).
- Location reads 57/100 on livability (#445 in KY) — a working-class tenant base; expect higher turnover. Strengths: cost of living A+, housing A+; Watch: crime C-, schools F, amenities F.
- Christian County (town): math 30% / reading 34% proficiency, ranked #93 of 165 in KY (top 56%) — families likely to look elsewhere, expect single-tenant / working-renter base with shorter leases; 61% free/reduced lunch — lower-income household profile, screen leases tightly.
- Market conditions: Rents flat; 83 active listings in the ZIP; 31 comparable units currently listed for rent nearby; rentals at typical pace (median 22d on market — plan ~3-4 weeks tenant-placement turnaround); 193 units permitted in Christian County in 2024 (66 in 5+ unit buildings).
- Christian County population projected at -20% by 2050 — secular population decline; favor cash flow + early exit over multi-decade hold.
- 2 sale attempts with the ask held roughly flat each time — persistent listings suggest the price (not the market) is what's stuck; bring a comps-based counter.
- Current owner paid $61k; list at $146k implies a 140% gain — meaningful room to come down on a strong offer.
- Climate carrying-cost: extreme-heat days projected 7→20/yr by 2055 (HVAC capex compounding) — expect insurance premiums to compound above CPI over the hold.
- Cap rate 6.9% vs local median 3.5% in Oak Grove — top-decile yield for the area; either an underpriced asset or a hidden risk that comps aren't pricing in. Stress-test before assuming the spread holds.
Questions for listing agent
- It's been on market 76 days. Have you received any prior offers? Is the seller open to a 17% concession, seller financing, or rate buy-down credit?
- Why hasn't it sold? Are there any deal-killer items the seller is aware of (foundation, flood, title, zoning, code violations)?
- Is there a deadline driving the sale (1031 exchange, divorce, estate, relocation)? That informs how much negotiation room exists.
- Schools are F-rated, which usually means shorter tenancies and higher turnover. Who's the typical renter profile here, and what's been the actual vacancy rate?
- What's the average days-on-market for RENTAL listings here right now (not sales)? A rising rental-DOM trend means longer vacancies and softer asking-rent achievability than the comps imply.
- What's the recent tenant-quality profile in this submarket — average credit score on applications, eviction rate, late-payment / NSF rate, and stable-employment percentage? A property-management company in the area should have these aggregated.
- How much new for-sale + rental construction is in the pipeline within 1–3 miles? Heavy new supply typically softens prices + rents 12–24 months out; constrained supply supports both.
CashFlowRE · CFR-V6CFDTCQVV6DMT
· Data 2 days ago
cashflowre.app · 2026-05-29