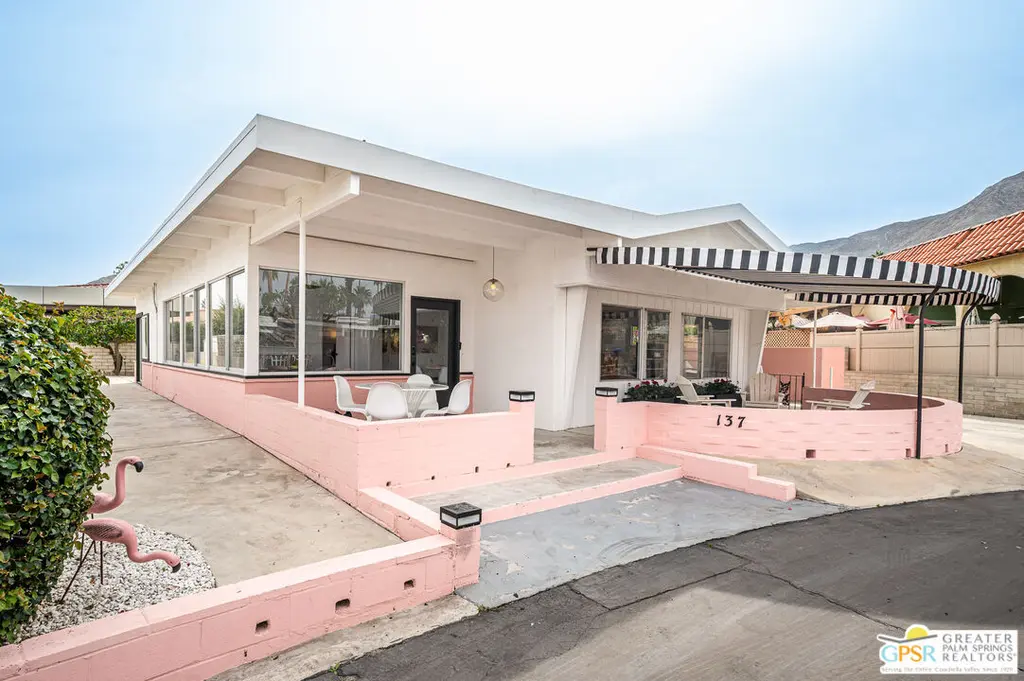
70260 Highway 111 #137
Rancho Mirage, CA 92270
$319,000D
3 bd · 2.5 ba ·
1,040 sqft ·
Built 1963
· Manufactured
· Active
· 125 DOM
Cashflow @ list (25.0% down · 7.5%)
Estimated rent
$3,471/mo
Mortgage (P&I)
−$1,673
Tax + insurance
−$364
HOA
−$432
Vac / Maint / Mgmt
−$729
Net cashflow
$273/mo
Annual
$3,274/yr
Cap rate
7.32%
Cash-on-cash
3.67%
DSCR
1.16
1% rule
1.09%
Cash to close
$89,320
Investor read
- This is a 3-bed/2.5-bath manufactured listed at $319k.
- At list price, monthly cash flow is $273 ($3k/yr) — positive.
- The deal already cash-flows at list — no discount required.
- Meets the 1% rule at list price ($3k rent vs $319k).
- It's been on market 125 days — a 12% lower offer ($281k) is reasonable based on typical stale-listing flexibility.
- Recommended offer: $281k (12.0% below list) — sets the bar for market timing.
- Local home prices are declining (-3.0%/yr); year-one equity from $2k of loan paydown is wiped out by about $10k of value loss. Plan a longer hold.
- Location reads 51/100 on livability (#1,065 in CA) — a working-class tenant base; expect higher turnover. Strengths: employment A+; Watch: amenities F, commute F, cost of living F.
- Palm Springs Unified (suburban): math 21% / reading 42% proficiency, ranked #328 of 517 in CA (top 63%) — families likely to look elsewhere, expect single-tenant / working-renter base with shorter leases; 73% free/reduced lunch — lower-income household profile, screen leases tightly.
- Market conditions: Rents rising (+3.7%/yr); 529 active listings in the ZIP; 10 comparable units currently listed for rent nearby; rentals lingering (median 44d on market — plan ~5-8 weeks vacancy on turnover, expect pricing pressure); 50% of comp listings sitting > 30 days — soft ceiling on asking rent; solid renter incomes; 9,195 units permitted in Riverside County in 2024 (1,512 in 5+ unit buildings).
- Riverside County population projected at +22% by 2050 — long-run rental-demand tailwind backs the buy-and-hold thesis.
- 6 sale attempts since 28y ago with the ask held roughly flat each time — persistent listings suggest the price (not the market) is what's stuck; bring a comps-based counter.
- Current owner paid $205k; list at $319k implies a 56% gain — meaningful room to come down on a strong offer.
- Climate carrying-cost: extreme-heat days projected 8→24/yr by 2055 (HVAC capex compounding) — expect insurance premiums to compound above CPI over the hold.
- Cap rate 7.3% vs local median 3.0% in Rancho Mirage — top-decile yield for the area; either an underpriced asset or a hidden risk that comps aren't pricing in. Stress-test before assuming the spread holds.
- This rent runs 39% of the median local income ($107k/yr) — at the standard rent-burdened threshold; future hikes will face affordability resistance.
Questions for listing agent
- It's been on market 125 days. Have you received any prior offers? Is the seller open to a 12% concession, seller financing, or rate buy-down credit?
- Built in 1963 — when were the roof, HVAC, electrical panel, plumbing, and water heater last replaced?
- What does the HOA fee cover, when was the last increase, and are there any pending special assessments or reserve-fund shortfalls?
- Why hasn't it sold? Are there any deal-killer items the seller is aware of (foundation, flood, title, zoning, code violations)?
- Is there a deadline driving the sale (1031 exchange, divorce, estate, relocation)? That informs how much negotiation room exists.
- The area grade is low — what's the realistic commute time and amenity access for the typical tenant pool here? Any planned neighborhood developments (good or bad) we should know about?
- What's the average days-on-market for RENTAL listings here right now (not sales)? A rising rental-DOM trend means longer vacancies and softer asking-rent achievability than the comps imply.
- What's the recent tenant-quality profile in this submarket — average credit score on applications, eviction rate, late-payment / NSF rate, and stable-employment percentage? A property-management company in the area should have these aggregated.
CashFlowRE · CFR-V77P9M4QP11YHP
· Data 2 days ago
cashflowre.app · 2026-05-29