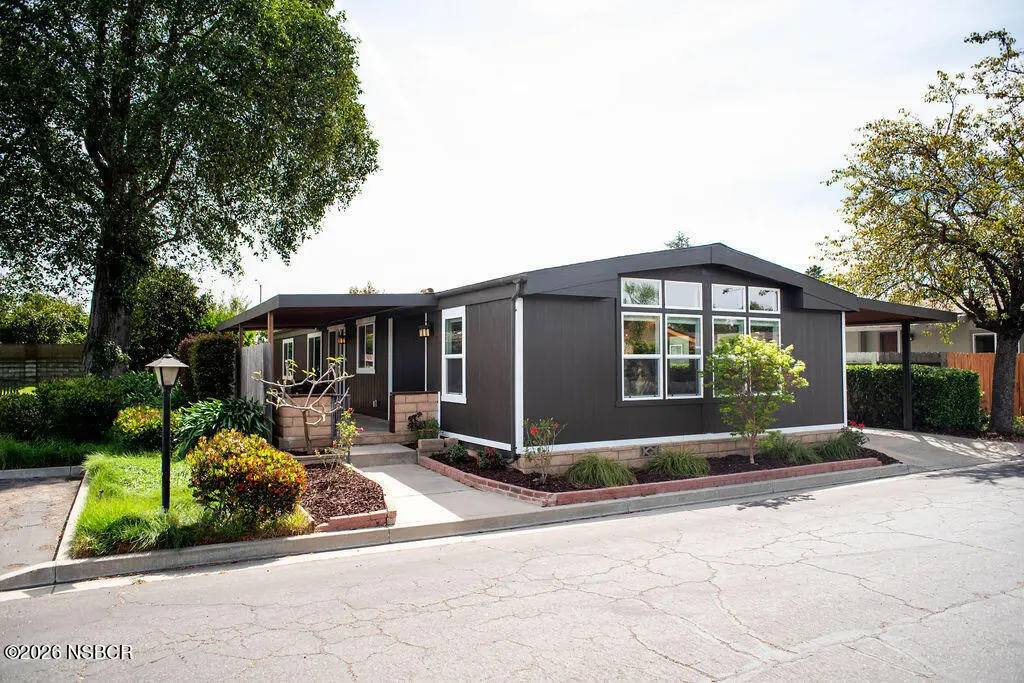
519 W Taylor St #12
Santa Maria, CA 93458
$299,900F
1 bd · 1.0 ba ·
1,440 sqft ·
Built 1980
· Manufactured
· Active
· 55 DOM
Cashflow @ list (25.0% down · 7.5%)
Estimated rent
$2,207/mo
Mortgage (P&I)
−$1,573
Tax + insurance
−$500
HOA
−$0
Vac / Maint / Mgmt
−$463
Net cashflow
$-329/mo
Annual
$-3,947/yr
Cap rate
4.98%
Cash-on-cash
-4.70%
DSCR
0.79
1% rule
0.74%
Cash to close
$83,972
Investor read
- This is a 1-bed/1.0-bath manufactured listed at $300k.
- At list price, monthly cash flow is $-329 ($-4k/yr) — negative.
- To cash-flow at today's rent, offer at most $252k (15.9% below list).
- To meet the 1% rule (rent ≥ 1% of price), the offer needs to be $221k (26.4% below list).
- It's been on market 55 days — a 3% lower offer ($291k) is reasonable based on typical stale-listing flexibility.
- Recommended offer: $221k (26.4% below list) — sets the bar for 1% rule.
- Local home prices are declining (-3.0%/yr); year-one equity from $2k of loan paydown is wiped out by about $9k of value loss. Plan a longer hold.
- Location reads 71/100 on livability (#202 in CA) — a middle-class / working-renter tenant base. Strengths: amenities A+, commute A+, health & safety A; Watch: schools F, crime F, cost of living F.
- Santa Maria-Bonita (urban): math 26% / reading 34% proficiency, ranked #1,023 of 1,400 in CA (top 73%) — families likely to look elsewhere, expect single-tenant / working-renter base with shorter leases; 72% free/reduced lunch — lower-income household profile, screen leases tightly.
- Market conditions: Rents rising (+2.3%/yr); 54 active listings in the ZIP; 2 comparable units currently listed for rent nearby; solid renter incomes; 719 units permitted in Santa Barbara County in 2024 (217 in 5+ unit buildings).
- Santa Barbara County population projected at +20% by 2050 — long-run rental-demand tailwind backs the buy-and-hold thesis.
- 8 sale attempts since 12y ago; this cycle's ask has dropped $39k (12%) from the opening price — seller is motivated, your offer sets the floor, not the list.
- Current owner paid $105k; list at $300k implies a 186% gain — meaningful room to come down on a strong offer.
- Climate carrying-cost: moderate wildfire risk — expect insurance premiums to compound above CPI over the hold.
- Cap rate 5.0% vs local median 3.5% in Santa Maria — top-decile yield for the area; either an underpriced asset or a hidden risk that comps aren't pricing in. Stress-test before assuming the spread holds.
- This rent runs 35% of the median local income ($75k/yr) — at the standard rent-burdened threshold; future hikes will face affordability resistance.
Questions for listing agent
- What do current leases actually rent for vs. the listed asking? Can we see a recent rent roll and the last 12 months of T-12 income?
- It's been on market 55 days. Have you received any prior offers? Is the seller open to a 26% concession, seller financing, or rate buy-down credit?
- Is there a deadline driving the sale (1031 exchange, divorce, estate, relocation)? That informs how much negotiation room exists.
- Schools are F-rated, which usually means shorter tenancies and higher turnover. Who's the typical renter profile here, and what's been the actual vacancy rate?
- Crime grade is F in this area — have there been break-ins, vandalism, or insurance claims at this property in the last 3 years? What carrier currently insures it and at what premium?
- The area grade is low — what's the realistic commute time and amenity access for the typical tenant pool here? Any planned neighborhood developments (good or bad) we should know about?
- What's the average days-on-market for RENTAL listings here right now (not sales)? A rising rental-DOM trend means longer vacancies and softer asking-rent achievability than the comps imply.
- What's the recent tenant-quality profile in this submarket — average credit score on applications, eviction rate, late-payment / NSF rate, and stable-employment percentage? A property-management company in the area should have these aggregated.
CashFlowRE · CFR-V7BT4MB24B40DA
· Data 2 days ago
cashflowre.app · 2026-05-29