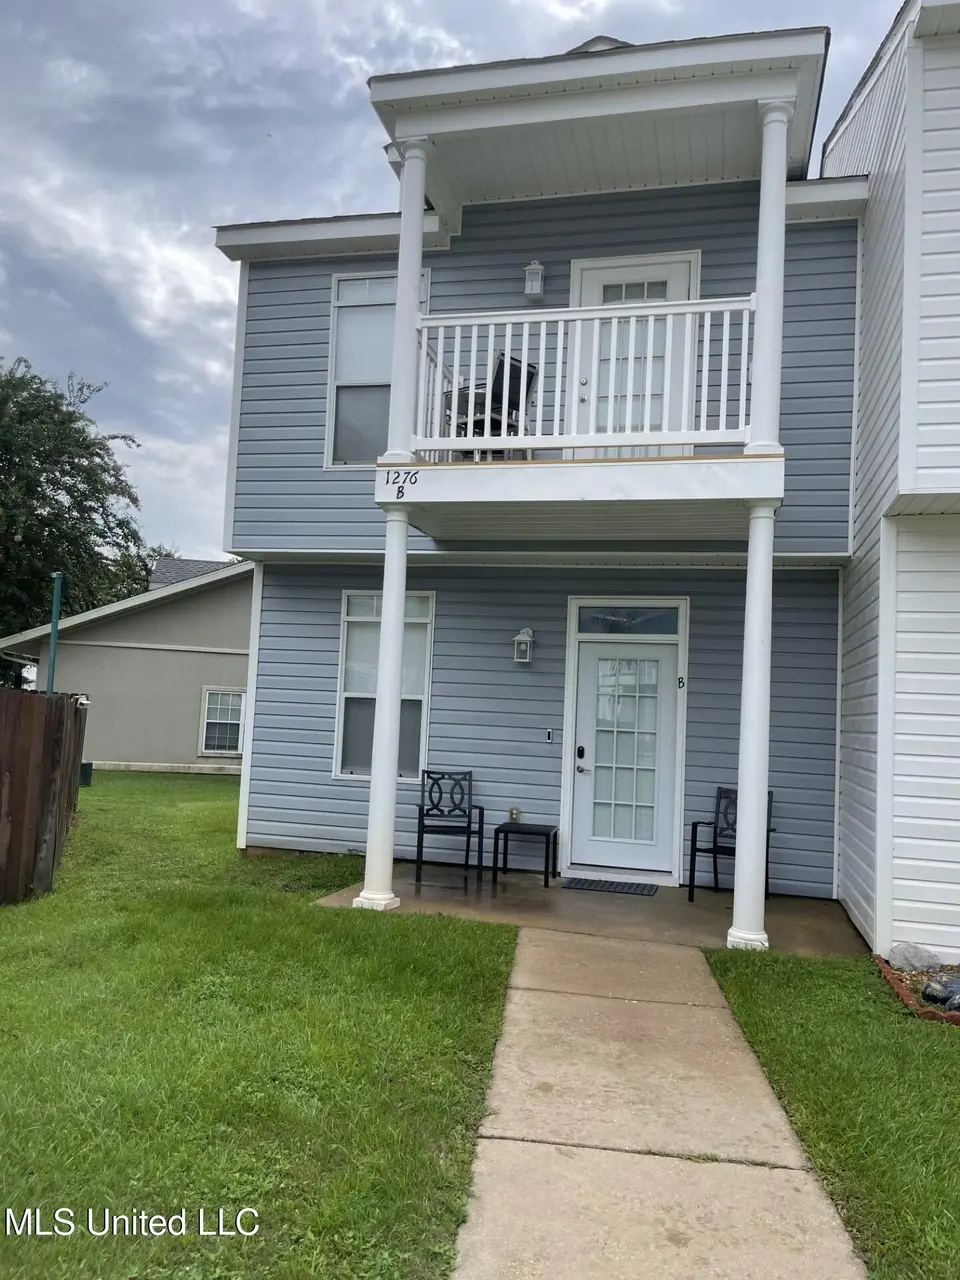
1276 Century Oaks Dr Unit B
Gulfport, MS 39507
$229,900D
3 bd · 3.0 ba ·
1,283 sqft ·
Built 2006
· Townhouse
· Active
· 398 DOM
Cashflow @ list (25.0% down · 7.5%)
Estimated rent
$2,009/mo
Mortgage (P&I)
−$1,206
Tax + insurance
−$383
HOA
−$165
Vac / Maint / Mgmt
−$422
Net cashflow
$-167/mo
Annual
$-2,000/yr
Cap rate
5.42%
Cash-on-cash
-3.11%
DSCR
0.86
1% rule
0.87%
Cash to close
$64,372
Investor read
- This is a 3-bed/3.0-bath townhouse listed at $230k. Condition is rated good.
- At list price, monthly cash flow is $-167 ($-2k/yr) — negative.
- To cash-flow at today's rent, offer at most $206k (10.5% below list).
- To meet the 1% rule (rent ≥ 1% of price), the offer needs to be $201k (12.6% below list).
- It's been on market 398 days — a 12% lower offer ($202k) is reasonable based on typical stale-listing flexibility.
- Recommended offer: $201k (12.6% below list) — sets the bar for 1% rule.
- Local home prices are declining (-3.0%/yr); year-one equity from $2k of loan paydown is wiped out by about $7k of value loss. Plan a longer hold.
- Location reads 73/100 on livability (#15 in MS) — a middle-class / working-renter tenant base. Strengths: cost of living A+, housing A+, health & safety A+; Watch: schools D, amenities F, commute F.
- Gulfport School District (urban): math 41% / reading 42% proficiency, ranked #37 of 130 in MS (top 28%) — families likely to look elsewhere, expect single-tenant / working-renter base with shorter leases; 67% free/reduced lunch — lower-income household profile, screen leases tightly.
- Market conditions: Rents rising fast (+4.3%/yr); 301 active listings in the ZIP; 25 comparable units currently listed for rent nearby; rentals lingering (median 44d on market — plan ~5-8 weeks vacancy on turnover, expect pricing pressure); 52% of comp listings sitting > 30 days — soft ceiling on asking rent; 2,194 units permitted in Harrison County in 2024 (0 in 5+ unit buildings).
- Harrison County population projected at +27% by 2050 — long-run rental-demand tailwind backs the buy-and-hold thesis.
- 3 sale attempts since 15y ago with the ask held roughly flat each time — persistent listings suggest the price (not the market) is what's stuck; bring a comps-based counter.
- Climate carrying-cost: major flood risk; severe wind risk, 99% chance of damaging wind over 30y; extreme-heat days projected 7→23/yr by 2055 (HVAC capex compounding) — expect insurance premiums to compound above CPI over the hold.
- This rent runs 44% of the median local income ($55k/yr) — at the standard rent-burdened threshold; future hikes will face affordability resistance.
Questions for listing agent
- What do current leases actually rent for vs. the listed asking? Can we see a recent rent roll and the last 12 months of T-12 income?
- It's been on market 398 days. Have you received any prior offers? Is the seller open to a 13% concession, seller financing, or rate buy-down credit?
- What does the HOA fee cover, when was the last increase, and are there any pending special assessments or reserve-fund shortfalls?
- Why hasn't it sold? Are there any deal-killer items the seller is aware of (foundation, flood, title, zoning, code violations)?
- Is there a deadline driving the sale (1031 exchange, divorce, estate, relocation)? That informs how much negotiation room exists.
- Schools are D-rated, which usually means shorter tenancies and higher turnover. Who's the typical renter profile here, and what's been the actual vacancy rate?
- The area grade is low — what's the realistic commute time and amenity access for the typical tenant pool here? Any planned neighborhood developments (good or bad) we should know about?
- What's the average days-on-market for RENTAL listings here right now (not sales)? A rising rental-DOM trend means longer vacancies and softer asking-rent achievability than the comps imply.
CashFlowRE · CFR-VCCBHT5PFE29HZ
· Data 2 days ago
cashflowre.app · 2026-05-29