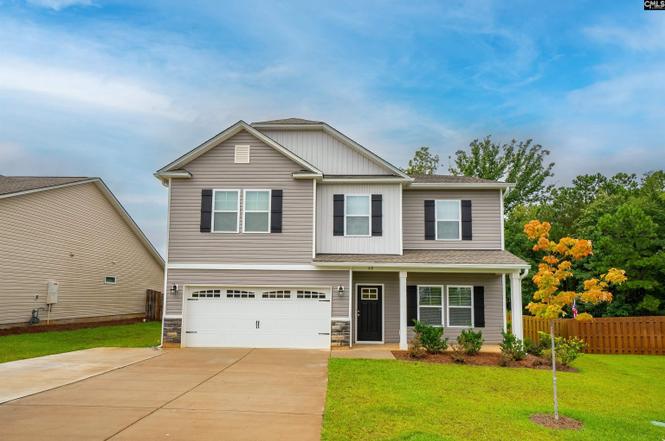
419 Saylor Hall Ln
Lake Murray of Richland, SC 29036
$350,000C-
5 bd · 3.0 ba ·
3,040 sqft ·
Built 2023
· SingleFamily
· Active
· 73 DOM
Cashflow @ list (25.0% down · 7.5%)
Estimated rent
$3,268/mo
Mortgage (P&I)
−$1,835
Tax + insurance
−$337
HOA
−$43
Vac / Maint / Mgmt
−$686
Net cashflow
$367/mo
Annual
$4,402/yr
Cap rate
7.55%
Cash-on-cash
4.49%
DSCR
1.20
1% rule
0.93%
Cash to close
$98,000
Investor read
- This is a 5-bed/3.0-bath single-family listed at $350k.
- At list price, monthly cash flow is $367 ($4k/yr) — positive.
- The deal already cash-flows at list — no discount required.
- To meet the 1% rule (rent ≥ 1% of price), the offer needs to be $327k (6.6% below list).
- It's been on market 73 days — a 6% lower offer ($329k) is reasonable based on typical stale-listing flexibility.
- Recommended offer: $327k (6.6% below list) — sets the bar for 1% rule.
- Local home prices are declining (-3.0%/yr); year-one equity from $2k of loan paydown is wiped out by about $10k of value loss. Plan a longer hold.
- Location reads 67/100 on livability (#102 in SC) — a middle-class / working-renter tenant base. Strengths: crime A+, employment A+, housing A+; Watch: amenities F, commute F, cost of living F.
- Lexington 05 (suburban): math 47% / reading 55% proficiency, ranked #5 of 80 in SC (top 6%) — acceptable for families but not a draw, mixed tenant base, ~2y average lease.
- Zoned schools: Chapin Elementary (math 53% / reading 51%, grade C-, #145 of 597 statewide, top 26%, 790 students, 34% FRL); Chapin High (math 82% / reading 91%, grade A, #7 of 196 statewide, top 4%, 1,615 students, 100% FRL) — zoned schools average 67% FRL vs 27% district-wide (40 pts higher); higher-poverty schools than district average — tighter screening recommended.
- Zoned-school proficiency averages 69% at this address vs 51% district-wide (+18 pts) — the actual schools serving this property are materially stronger than the Lexington 05 average implies; a family-tenant draw the district grade alone would hide.
- Market conditions: 434 active listings in the ZIP; 2 comparable units currently listed for rent nearby; high-income renter base; 1,712 units permitted in Lexington County in 2024 (0 in 5+ unit buildings).
- Lexington County population projected at +26% by 2050 — long-run rental-demand tailwind backs the buy-and-hold thesis.
- 5 sale attempts since 3y ago with the ask held roughly flat each time — persistent listings suggest the price (not the market) is what's stuck; bring a comps-based counter.
- This rent runs 34% of the median local income ($114k/yr) — at the standard rent-burdened threshold; future hikes will face affordability resistance.
Questions for listing agent
- It's been on market 73 days. Have you received any prior offers? Is the seller open to a 7% concession, seller financing, or rate buy-down credit?
- What does the HOA fee cover, when was the last increase, and are there any pending special assessments or reserve-fund shortfalls?
- Why hasn't it sold? Are there any deal-killer items the seller is aware of (foundation, flood, title, zoning, code violations)?
- Is there a deadline driving the sale (1031 exchange, divorce, estate, relocation)? That informs how much negotiation room exists.
- Schools are D-rated, which usually means shorter tenancies and higher turnover. Who's the typical renter profile here, and what's been the actual vacancy rate?
- What's the average days-on-market for RENTAL listings here right now (not sales)? A rising rental-DOM trend means longer vacancies and softer asking-rent achievability than the comps imply.
- What's the recent tenant-quality profile in this submarket — average credit score on applications, eviction rate, late-payment / NSF rate, and stable-employment percentage? A property-management company in the area should have these aggregated.
- How much new for-sale + rental construction is in the pipeline within 1–3 miles? Heavy new supply typically softens prices + rents 12–24 months out; constrained supply supports both.
CashFlowRE · CFR-VCTH85ET8GADJD
· Data 2 days ago
cashflowre.app · 2026-05-29