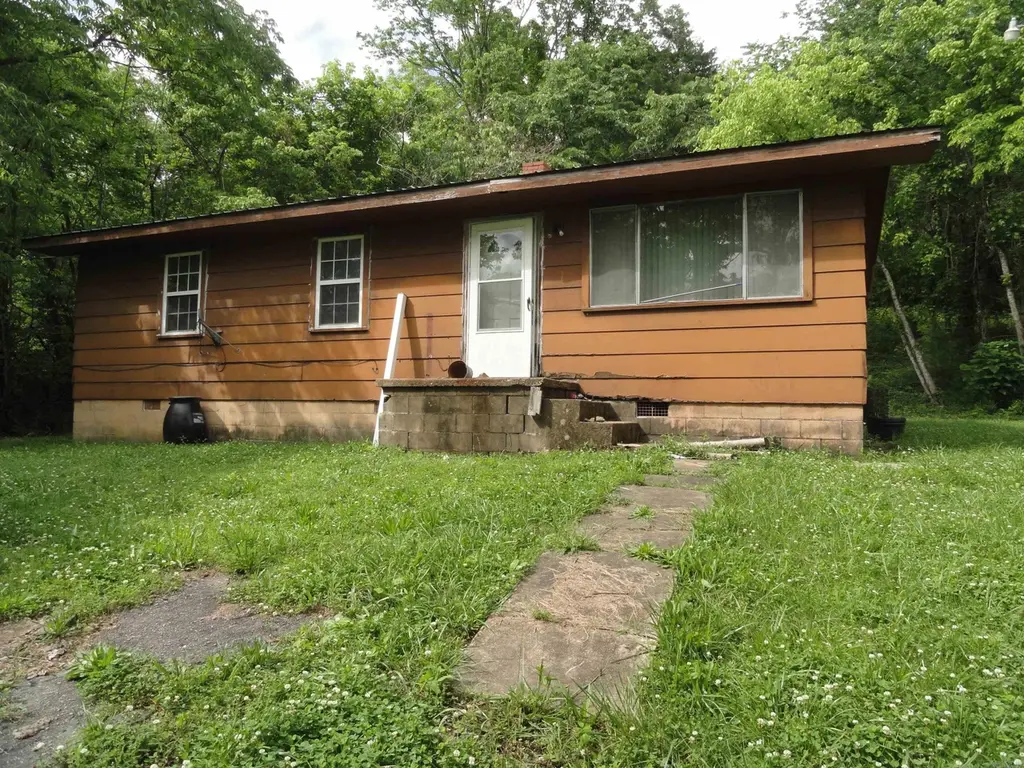
813 Main St
Leslie, AR 72645
$40,000B+
3 bd · 1.0 ba ·
1,120 sqft ·
Built 1974
· SingleFamily
· Price Change
· 386 DOM
Cashflow @ list (25.0% down · 7.5%)
Estimated rent
$1,034/mo
Mortgage (P&I)
−$210
Tax + insurance
−$57
HOA
−$0
Vac / Maint / Mgmt
−$217
Net cashflow
$550/mo
Annual
$6,605/yr
Cap rate
22.80%
Cash-on-cash
58.97%
DSCR
3.62
1% rule
2.58%
Cash to close
$11,200
Investor read
- This is a 3-bed/1.0-bath single-family listed at $40k.
- At list price, monthly cash flow is $550 ($7k/yr) — positive.
- The deal already cash-flows at list — no discount required.
- Meets the 1% rule at list price ($1k rent vs $40k).
- It's been on market 386 days — a 12% lower offer ($35k) is reasonable based on typical stale-listing flexibility.
- Recommended offer: $35k (12.0% below list) — sets the bar for market timing.
- In year one you build about $4k of equity ($277 loan paydown + $4k appreciation (9.3% local appreciation)).
- Location reads 63/100 on livability (#202 in AR) — a middle-class / working-renter tenant base. Strengths: cost of living A+, housing B+; Watch: crime F, amenities F, commute F.
- Searcy County School District (rural): math 39% / reading 40% proficiency, ranked #82 of 238 in AR (top 34%) — families likely to look elsewhere, expect single-tenant / working-renter base with shorter leases.
- Zoned schools: Marshall Elementary School (math 64% / reading 34%, grade D, #93 of 454 statewide, top 23%, 293 students, 99% FRL); Leslie Elementary School (math 47% / reading 37%, grade D-, #78 of 201 statewide, top 40%, 190 students, 98% FRL); Marshall High School (math 28% / reading 43%, grade F, #85 of 292 statewide, top 30%, 358 students, 99% FRL) — zoned schools average 99% FRL vs 57% district-wide (42 pts higher); higher-poverty schools than district average — tighter screening recommended.
- Market conditions: 23 active listings in the ZIP.
- Searcy County population projected at -26% by 2050 — secular population decline; favor cash flow + early exit over multi-decade hold.
- 2 sale attempts; this cycle's ask has dropped $20k (33%) from the opening price — seller is motivated, your offer sets the floor, not the list.
- At projected returns (9.3% appreciation + 3.0% rent growth), your $11k cash investment doubles in ~2 years — after that, you're playing with house money.
- By year 8, paydown + projected appreciation supports a ~$34k cash-out refi (75% LTV) — recoverable capital for the next deal without selling this one.
Questions for listing agent
- It's been on market 386 days. Have you received any prior offers? Is the seller open to a 12% concession, seller financing, or rate buy-down credit?
- Built in 1974 — when were the roof, HVAC, electrical panel, plumbing, and water heater last replaced?
- Why hasn't it sold? Are there any deal-killer items the seller is aware of (foundation, flood, title, zoning, code violations)?
- Is there a deadline driving the sale (1031 exchange, divorce, estate, relocation)? That informs how much negotiation room exists.
- Crime grade is F in this area — have there been break-ins, vandalism, or insurance claims at this property in the last 3 years? What carrier currently insures it and at what premium?
- What's the average days-on-market for RENTAL listings here right now (not sales)? A rising rental-DOM trend means longer vacancies and softer asking-rent achievability than the comps imply.
- What's the recent tenant-quality profile in this submarket — average credit score on applications, eviction rate, late-payment / NSF rate, and stable-employment percentage? A property-management company in the area should have these aggregated.
- How much new for-sale + rental construction is in the pipeline within 1–3 miles? Heavy new supply typically softens prices + rents 12–24 months out; constrained supply supports both.
CashFlowRE · CFR-VE4N0R13NK3YTE
· Data 3 h ago
cashflowre.app · 2026-05-29