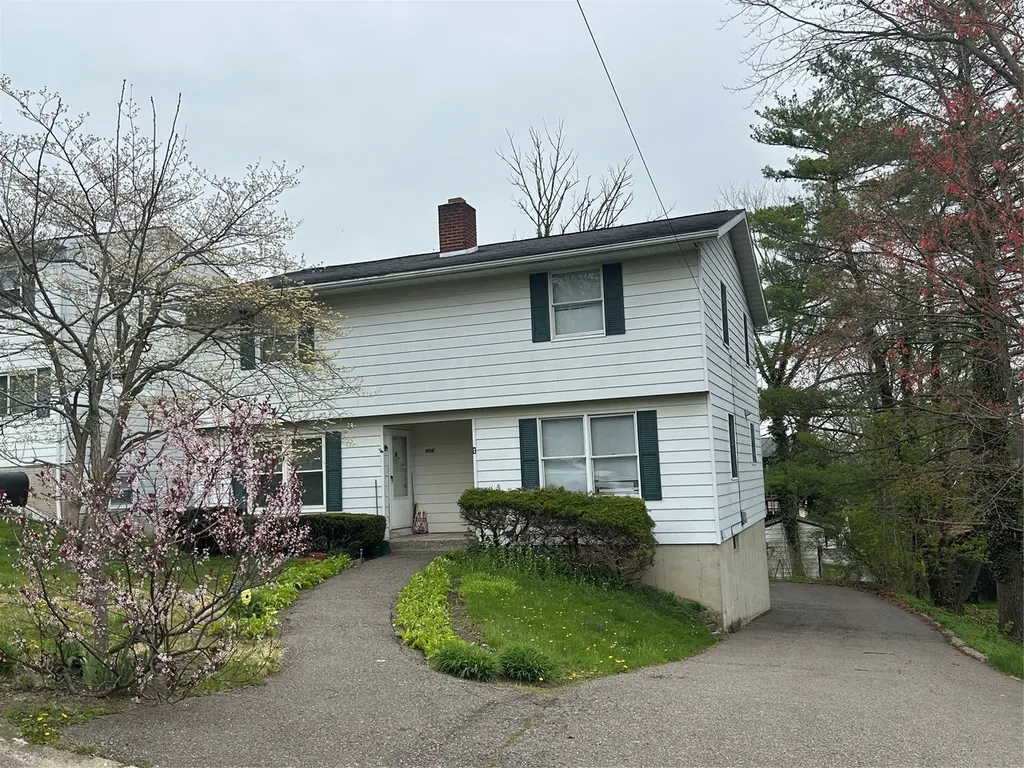
906-908 Irving Ave
Endicott, NY 13760
$199,900B+
4 bd · 2.0 ba ·
2,052 sqft ·
Built 1970
· MultiFamily
· Pending
· 8 DOM
Cashflow @ list (25.0% down · 7.5%)
Estimated rent
$2,787/mo
Mortgage (P&I)
−$1,048
Tax + insurance
−$530
HOA
−$0
Vac / Maint / Mgmt
−$585
Net cashflow
$624/mo
Annual
$7,486/yr
Cap rate
10.04%
Cash-on-cash
13.38%
DSCR
1.60
1% rule
1.39%
Cash to close
$55,972
Investor read
- This is a 2 × 2-bed/1.5-bath units multifamily listed at $200k.
- At list price, monthly cash flow is $624 ($7k/yr) — positive. Per door: $312/mo.
- The deal already cash-flows at list — no discount required.
- Meets the 1% rule at list price ($3k rent vs $200k).
- Only 8 days on market — expect competitive offers; lowballing is unlikely to land.
- Local home prices are declining (-3.0%/yr); year-one equity from $1k of loan paydown is wiped out by about $6k of value loss. Plan a longer hold.
- Location reads 70/100 on livability (#438 in NY) — a middle-class / working-renter tenant base. Strengths: cost of living A+, health & safety A+, housing A; Watch: amenities D, crime F, commute F.
- Union-Endicott Central School District (suburban): math 43% / reading 57% proficiency, ranked #387 of 590 in NY (top 66%) — acceptable for families but not a draw, mixed tenant base, ~2y average lease.
- Zoned schools: George F Johnson Elementary School (math 35% / reading 47%, grade F, #1,410 of 2,108 statewide, top 67%, 596 students, 44% FRL) — zoned schools at 44% FRL track the district average.
- Watch-outs: property tax is 2.7% of price.
- Market conditions: Rents rising fast (+7.1%/yr); 213 active listings in the ZIP; 3 comparable units currently listed for rent nearby; rentals lingering (median 45d on market — plan ~5-8 weeks vacancy on turnover, expect pricing pressure); 67% of comp listings sitting > 30 days — soft ceiling on asking rent; 340 units permitted in Broome County in 2024 (269 in 5+ unit buildings).
- Broome County population projected at -13% by 2050 — secular population decline; favor cash flow + early exit over multi-decade hold.
- 2 sale attempts since 8y ago with the ask held roughly flat each time — persistent listings suggest the price (not the market) is what's stuck; bring a comps-based counter.
- At projected returns (-3.0% appreciation + 7.1% rent growth), your $56k cash investment doubles in ~7 years — after that, you're playing with house money.
- Cap rate 10.0% vs local median 5.5% in Endicott — top-decile yield for the area; either an underpriced asset or a hidden risk that comps aren't pricing in. Stress-test before assuming the spread holds.
- At $2,787/mo this rent would consume 51% of the median local household income ($66k/yr) (locally 1480% of renters already pay >50% of income on rent) — very limited rent-growth headroom before tenants either downsize or default.
Questions for listing agent
- Can we see the unit-by-unit rent roll, current vacancy, and any below-market leases? What's the average tenancy length?
- What capital expenditures (roof, boiler, parking lot, exteriors) have been made in the last 5 years, and what's planned in the next 2?
- Built in 1970 — when were the roof, HVAC, electrical panel, plumbing, and water heater last replaced?
- Property tax is high relative to price — has the assessment been appealed recently, and will the sale trigger a re-assessment?
- Is there a deadline driving the sale (1031 exchange, divorce, estate, relocation)? That informs how much negotiation room exists.
- Schools are D-rated, which usually means shorter tenancies and higher turnover. Who's the typical renter profile here, and what's been the actual vacancy rate?
- Crime grade is F in this area — have there been break-ins, vandalism, or insurance claims at this property in the last 3 years? What carrier currently insures it and at what premium?
- What's the average days-on-market for RENTAL listings here right now (not sales)? A rising rental-DOM trend means longer vacancies and softer asking-rent achievability than the comps imply.
CashFlowRE · CFR-VE9V2C5R8ZB53J
· Data 3 weeks ago
cashflowre.app · 2026-05-29