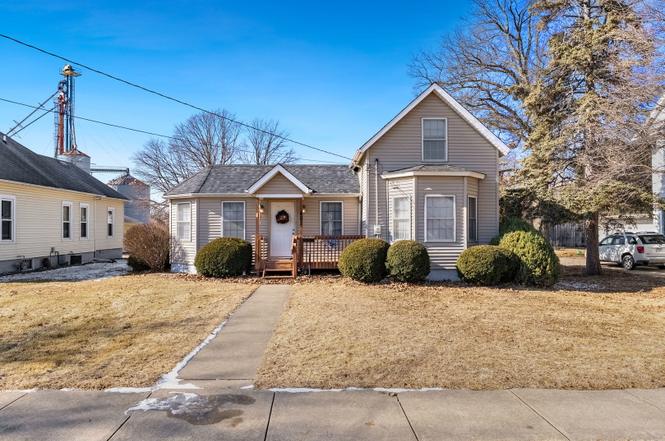
401 N Ridge St
Cambridge, IL 61238
$145,000D-
2 bd · 1.0 ba ·
1,192 sqft ·
Built 1910
· SingleFamily
· Pending
· 53 DOM
Cashflow @ list (25.0% down · 7.5%)
Estimated rent
$1,120/mo
Mortgage (P&I)
−$760
Tax + insurance
−$179
HOA
−$0
Vac / Maint / Mgmt
−$235
Net cashflow
$-55/mo
Annual
$-661/yr
Cap rate
5.84%
Cash-on-cash
-1.63%
DSCR
0.93
1% rule
0.77%
Cash to close
$40,600
Investor read
- This is a 2-bed/1.0-bath single-family listed at $145k.
- At list price, monthly cash flow is $-55 ($-661/yr) — negative.
- To cash-flow at today's rent, offer at most $135k (6.7% below list).
- To meet the 1% rule (rent ≥ 1% of price), the offer needs to be $112k (22.8% below list).
- It's been on market 53 days — a 3% lower offer ($141k) is reasonable based on typical stale-listing flexibility.
- Recommended offer: $112k (22.8% below list) — sets the bar for 1% rule.
- In year one you build about $13k of equity ($1k loan paydown + $12k appreciation (8.3% local appreciation)).
- Location reads 66/100 on livability (#584 in IL) — a middle-class / working-renter tenant base. Strengths: crime A+, cost of living A+, housing A+; Watch: amenities F, commute F, health & safety F.
- Cambridge CUSD 227 (rural): math 28% / reading 37% proficiency, ranked #215 of 620 in IL (top 35%) — families likely to look elsewhere, expect single-tenant / working-renter base with shorter leases.
- Zoned schools: Cambridge Comm Grade School (math 37% / reading 52%, grade F, #267 of 2,056 statewide, top 15%, 234 students, 0% FRL); Cambridge Jr/Sr High School (math 22% / reading 27%, grade F, #256 of 693 statewide, top 44%, 227 students, 0% FRL) — zoned schools average 0% FRL vs 26% district-wide (26 pts lower); this property's tenant base skews higher-income than the district average.
- Watch-outs: built in 1910 — expect roof / HVAC / electrical / plumbing capex.
- Market conditions: 15 active listings in the ZIP; 32 units permitted in Henry County in 2024 (0 in 5+ unit buildings).
- Henry County population projected at -16% by 2050 — secular population decline; favor cash flow + early exit over multi-decade hold.
- 4 sale attempts since 25y ago with the ask held roughly flat each time — persistent listings suggest the price (not the market) is what's stuck; bring a comps-based counter.
- At projected returns (8.3% appreciation + 3.0% rent growth), your $41k cash investment doubles in ~3 years — after that, you're playing with house money.
- By year 3, paydown + projected appreciation supports a ~$33k cash-out refi (75% LTV) — recoverable capital for the next deal without selling this one.
Questions for listing agent
- What do current leases actually rent for vs. the listed asking? Can we see a recent rent roll and the last 12 months of T-12 income?
- It's been on market 53 days. Have you received any prior offers? Is the seller open to a 23% concession, seller financing, or rate buy-down credit?
- Built in 1910 — when were the roof, HVAC, electrical panel, plumbing, and water heater last replaced?
- Is there a deadline driving the sale (1031 exchange, divorce, estate, relocation)? That informs how much negotiation room exists.
- Schools are F-rated, which usually means shorter tenancies and higher turnover. Who's the typical renter profile here, and what's been the actual vacancy rate?
- The area grade is low — what's the realistic commute time and amenity access for the typical tenant pool here? Any planned neighborhood developments (good or bad) we should know about?
- What's the average days-on-market for RENTAL listings here right now (not sales)? A rising rental-DOM trend means longer vacancies and softer asking-rent achievability than the comps imply.
- What's the recent tenant-quality profile in this submarket — average credit score on applications, eviction rate, late-payment / NSF rate, and stable-employment percentage? A property-management company in the area should have these aggregated.
CashFlowRE · CFR-VENZRF3CDDRZ70
· Data 3 weeks ago
cashflowre.app · 2026-05-29