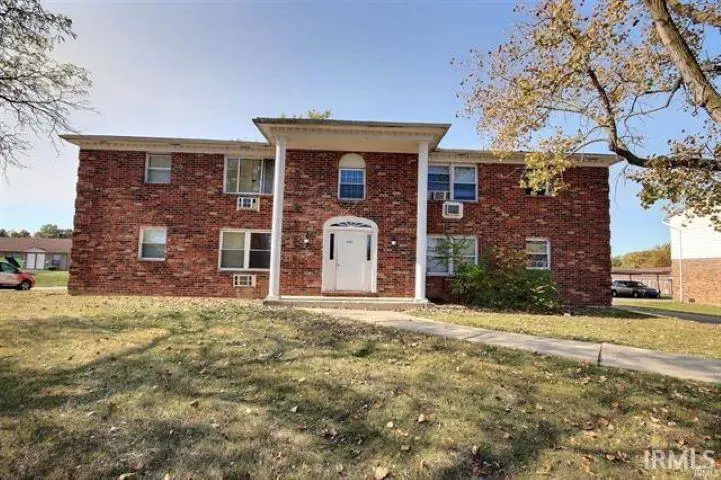
6301 Reed Rd
Fort Wayne, IN 46835
$359,000B
8 bd · 4.8 ba ·
4,436 sqft ·
Built 1972
· MultiFamily
· Pending
· 34 DOM
Cashflow @ list (25.0% down · 7.5%)
Estimated rent
$6,091/mo
Mortgage (P&I)
−$1,883
Tax + insurance
−$332
HOA
−$0
Vac / Maint / Mgmt
−$1,279
Net cashflow
$2,597/mo
Annual
$31,167/yr
Cap rate
14.97%
Cash-on-cash
31.01%
DSCR
2.38
1% rule
1.70%
Cash to close
$100,520
Investor read
- This is a 2×3bd/1.5ba + 2×2bd/1ba units multifamily listed at $359k.
- At list price, monthly cash flow is $3k ($31k/yr) — positive. Per door: $649/mo.
- The deal already cash-flows at list — no discount required.
- Meets the 1% rule at list price ($6k rent vs $359k).
- It's been on market 34 days — a 3% lower offer ($348k) is reasonable based on typical stale-listing flexibility.
- Recommended offer: $348k (3.0% below list) — sets the bar for market timing.
- Local home prices are declining (-3.0%/yr); year-one equity from $2k of loan paydown is wiped out by about $11k of value loss. Plan a longer hold.
- Location reads 84/100 on livability (#6 in IN, #676 nationally) — a professional / high-income tenant draw. Strengths: amenities A+, commute A+, cost of living A+; Watch: crime C-, schools D+, employment D+.
- Fort Wayne Community Schools (urban): math 22% / reading 29% proficiency, ranked #263 of 301 in IN (top 87%) — low school quality limits family demand, transient renter base, plan for 1-2y turnover; 60% free/reduced lunch — lower-income household profile, screen leases tightly.
- Market conditions: Rents rising fast (+8.9%/yr); 181 active listings in the ZIP; solid renter incomes; 1,861 units permitted in Allen County in 2024 (576 in 5+ unit buildings).
- Allen County population projected at +10% by 2050 — modest demand growth; plan on rents tracking national, not racing it.
- 2 sale attempts; this cycle's ask has dropped $20k (5%) from the opening price — seller is motivated, your offer sets the floor, not the list.
- At projected returns (-3.0% appreciation + 8.0% rent growth), your $101k cash investment doubles in ~4 years — after that, you're playing with house money.
- Cap rate 15.0% vs local median 4.8% in Fort Wayne — top-decile yield for the area; either an underpriced asset or a hidden risk that comps aren't pricing in. Stress-test before assuming the spread holds.
- At $6,091/mo this rent would consume 95% of the median local household income ($77k/yr) (locally 961% of renters already pay >50% of income on rent) — very limited rent-growth headroom before tenants either downsize or default.
Questions for listing agent
- It's been on market 34 days. Have you received any prior offers? Is the seller open to a 3% concession, seller financing, or rate buy-down credit?
- Can we see the unit-by-unit rent roll, current vacancy, and any below-market leases? What's the average tenancy length?
- What capital expenditures (roof, boiler, parking lot, exteriors) have been made in the last 5 years, and what's planned in the next 2?
- Built in 1972 — when were the roof, HVAC, electrical panel, plumbing, and water heater last replaced?
- Is there a deadline driving the sale (1031 exchange, divorce, estate, relocation)? That informs how much negotiation room exists.
- Schools are D-rated, which usually means shorter tenancies and higher turnover. Who's the typical renter profile here, and what's been the actual vacancy rate?
- What's the average days-on-market for RENTAL listings here right now (not sales)? A rising rental-DOM trend means longer vacancies and softer asking-rent achievability than the comps imply.
- What's the recent tenant-quality profile in this submarket — average credit score on applications, eviction rate, late-payment / NSF rate, and stable-employment percentage? A property-management company in the area should have these aggregated.
CashFlowRE · CFR-VF7WZC0SNAPWWH
· Data 3 weeks ago
cashflowre.app · 2026-05-29