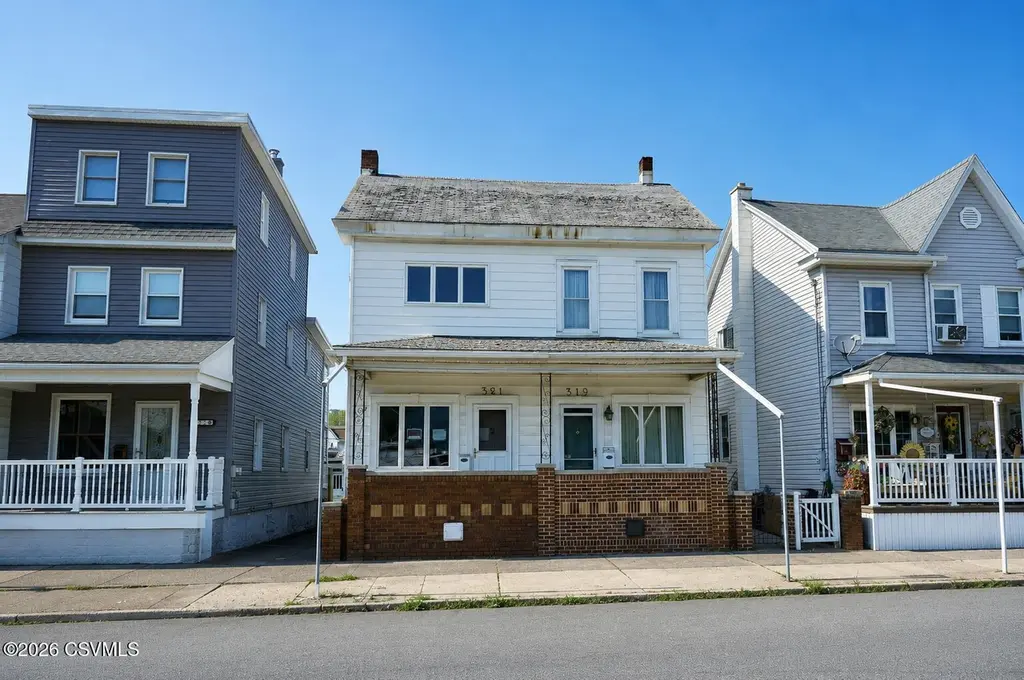
321 W 5th St
Mount Carmel, PA 17851
$59,000B+
3 bd · 1.0 ba ·
1,352 sqft ·
Built 1900
· Other
· Pending
· 2 DOM
Cashflow @ list (25.0% down · 7.5%)
Estimated rent
$1,450/mo
Mortgage (P&I)
−$309
Tax + insurance
−$165
HOA
−$0
Vac / Maint / Mgmt
−$304
Net cashflow
$671/mo
Annual
$8,050/yr
Cap rate
21.07%
Cash-on-cash
52.76%
DSCR
3.35
1% rule
2.46%
Cash to close
$16,520
Investor read
- This is a 3-bed/1.0-bath other listed at $59k.
- At list price, monthly cash flow is $671 ($8k/yr) — positive.
- The deal already cash-flows at list — no discount required.
- Meets the 1% rule at list price ($1k rent vs $59k).
- Only 2 days on market — expect competitive offers; lowballing is unlikely to land.
- In year one you build about $4k of equity ($408 loan paydown + $4k appreciation (6.3% local appreciation)).
- Location reads 72/100 on livability (#641 in PA) — a middle-class / working-renter tenant base. Strengths: cost of living A+, health & safety A+, crime B+; Watch: schools D+, commute F, employment F.
- Mount Carmel Area SD (town): math 20% / reading 37% proficiency, ranked #455 of 539 in PA (top 84%) — low school quality limits family demand, transient renter base, plan for 1-2y turnover.
- Watch-outs: flood insurance adds $56/mo; built in 1900 — expect roof / HVAC / electrical / plumbing capex.
- Market conditions: 54 active listings in the ZIP; 1 comparable units currently listed for rent nearby; 81 units permitted in Northumberland County in 2024 (0 in 5+ unit buildings).
- Northumberland County population projected at -11% by 2050 — secular population decline; favor cash flow + early exit over multi-decade hold.
- 3 sale attempts since 5y ago with the ask held roughly flat each time — persistent listings suggest the price (not the market) is what's stuck; bring a comps-based counter.
- At projected returns (6.3% appreciation + 3.0% rent growth), your $17k cash investment doubles in ~2 years — after that, you're playing with house money.
- By year 8, paydown + projected appreciation supports a ~$32k cash-out refi (75% LTV) — recoverable capital for the next deal without selling this one.
- Climate carrying-cost: major flood risk — expect insurance premiums to compound above CPI over the hold.
- Cap rate 21.1% vs local median 12.2% in Mount Carmel — top-decile yield for the area; either an underpriced asset or a hidden risk that comps aren't pricing in. Stress-test before assuming the spread holds.
Questions for listing agent
- Built in 1900 — when were the roof, HVAC, electrical panel, plumbing, and water heater last replaced?
- What's the actual annual flood-insurance premium (NFIP or private), and is the property in a SFHA with mandatory coverage?
- Is there a deadline driving the sale (1031 exchange, divorce, estate, relocation)? That informs how much negotiation room exists.
- Schools are D-rated, which usually means shorter tenancies and higher turnover. Who's the typical renter profile here, and what's been the actual vacancy rate?
- What's the average days-on-market for RENTAL listings here right now (not sales)? A rising rental-DOM trend means longer vacancies and softer asking-rent achievability than the comps imply.
- What's the recent tenant-quality profile in this submarket — average credit score on applications, eviction rate, late-payment / NSF rate, and stable-employment percentage? A property-management company in the area should have these aggregated.
- How much new for-sale + rental construction is in the pipeline within 1–3 miles? Heavy new supply typically softens prices + rents 12–24 months out; constrained supply supports both.
CashFlowRE · CFR-VFSE7B0YTP2PNQ
· Data 6 days ago
cashflowre.app · 2026-05-29