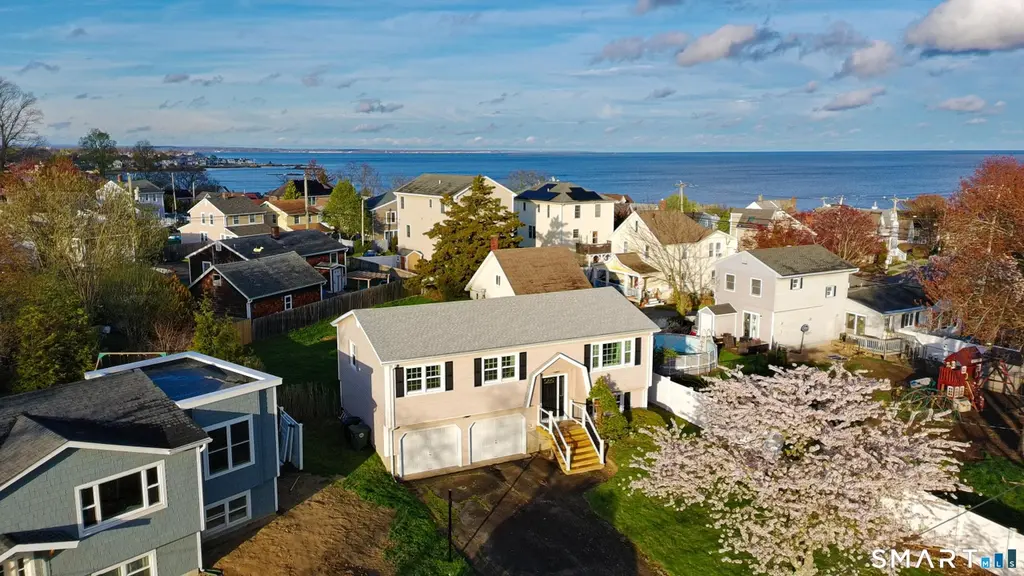
12 Nolan Ter
Milford city (balance), CT 06460
$569,000F
3 bd · 1.5 ba ·
1,209 sqft ·
Built 1980
· SingleFamily
· Under Contract
· 7 DOM
Cashflow @ list (25.0% down · 7.5%)
Estimated rent
$2,702/mo
Mortgage (P&I)
−$2,984
Tax + insurance
−$734
HOA
−$0
Vac / Maint / Mgmt
−$567
Net cashflow
$-1,583/mo
Annual
$-18,998/yr
Cap rate
2.95%
Cash-on-cash
-11.92%
DSCR
0.47
1% rule
0.47%
Cash to close
$159,320
Investor read
- This is a 3-bed/1.5-bath single-family listed at $569k.
- At list price, monthly cash flow is $-2k ($-19k/yr) — negative.
- To cash-flow at today's rent, offer at most $289k (49.2% below list).
- To meet the 1% rule (rent ≥ 1% of price), the offer needs to be $270k (52.5% below list).
- Only 7 days on market — expect competitive offers; lowballing is unlikely to land.
- Recommended offer: $270k (52.5% below list) — sets the bar for 1% rule.
- Local home prices are declining (-3.0%/yr); year-one equity from $4k of loan paydown is wiped out by about $17k of value loss. Plan a longer hold.
- Location reads: area grade F — affects rentability + tenant quality, not the cash-flow math above.
- Milford School District (urban): math 44% / reading 58% proficiency, ranked #73 of 153 in CT (top 48%) — acceptable for families but not a draw, mixed tenant base, ~2y average lease; only 15% free/reduced lunch — higher-income household profile.
- Zoned schools: Joseph A. Foran High School (math 47% / reading 67%, grade C, #52 of 194 statewide, top 31%, 765 students, 26% FRL).
- Market conditions: Rents rising (+2.2%/yr); 175 active listings in the ZIP; 13 comparable units currently listed for rent nearby; rentals leasing fast (median 12d on market — plan ~1-2 weeks tenant-placement turnaround); solid renter incomes; 1,059 units permitted in South Central Connecticut Planning Region in 2024 (779 in 5+ unit buildings).
- 2 sale attempts with the ask held roughly flat each time — persistent listings suggest the price (not the market) is what's stuck; bring a comps-based counter.
- Current owner paid $420k; 35% above their basis — modest negotiation headroom, anchor on the comps not their cost.
- This rent runs 31% of the median local income ($104k/yr) — at the standard rent-burdened threshold; future hikes will face affordability resistance.
Questions for listing agent
- What do current leases actually rent for vs. the listed asking? Can we see a recent rent roll and the last 12 months of T-12 income?
- Is there a deadline driving the sale (1031 exchange, divorce, estate, relocation)? That informs how much negotiation room exists.
- The area grade is low — what's the realistic commute time and amenity access for the typical tenant pool here? Any planned neighborhood developments (good or bad) we should know about?
- What's the average days-on-market for RENTAL listings here right now (not sales)? A rising rental-DOM trend means longer vacancies and softer asking-rent achievability than the comps imply.
- What's the recent tenant-quality profile in this submarket — average credit score on applications, eviction rate, late-payment / NSF rate, and stable-employment percentage? A property-management company in the area should have these aggregated.
- How much new for-sale + rental construction is in the pipeline within 1–3 miles? Heavy new supply typically softens prices + rents 12–24 months out; constrained supply supports both.
CashFlowRE · CFR-VGCYH6FPJFEY5R
· Data 3 weeks ago
cashflowre.app · 2026-05-29