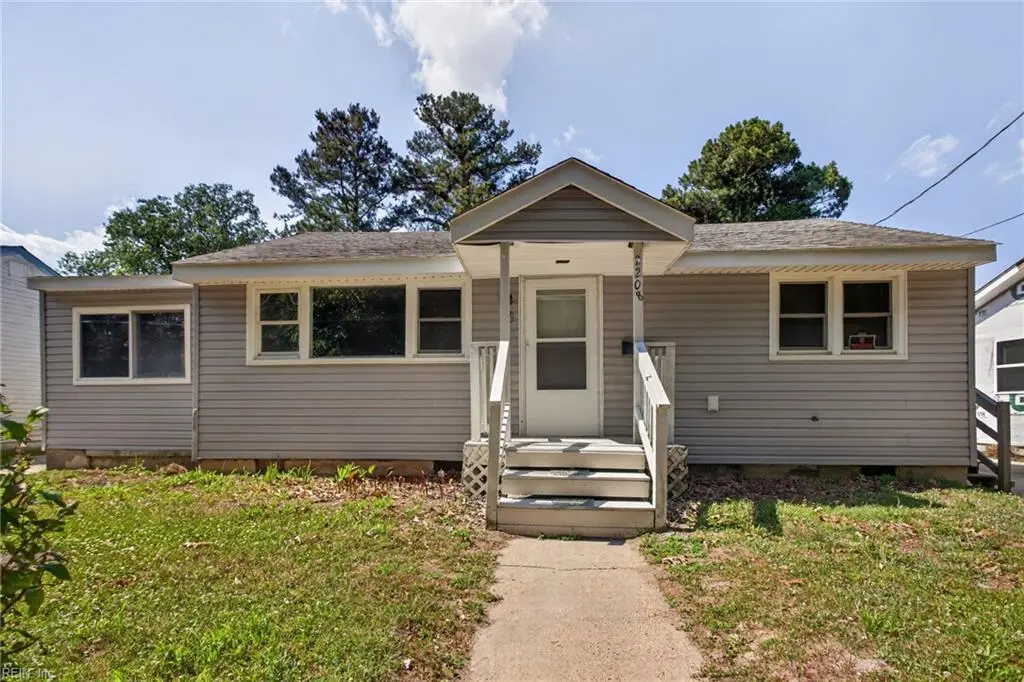
2208 Georgia Ave
Suffolk, VA 23434
$245,000D
2 bd · 1.0 ba ·
1,117 sqft ·
Built 1947
· SingleFamily
· Under Contract
· 4 DOM
Cashflow @ list (25.0% down · 7.5%)
Estimated rent
$1,872/mo
Mortgage (P&I)
−$1,285
Tax + insurance
−$259
HOA
−$0
Vac / Maint / Mgmt
−$393
Net cashflow
$-66/mo
Annual
$-788/yr
Cap rate
5.97%
Cash-on-cash
-1.15%
DSCR
0.95
1% rule
0.76%
Cash to close
$68,600
Investor read
- This is a 2-bed/1.0-bath single-family listed at $245k.
- At list price, monthly cash flow is $-66 ($-788/yr) — negative.
- To cash-flow at today's rent, offer at most $233k (4.7% below list).
- To meet the 1% rule (rent ≥ 1% of price), the offer needs to be $187k (23.6% below list).
- Only 4 days on market — expect competitive offers; lowballing is unlikely to land.
- Recommended offer: $187k (23.6% below list) — sets the bar for 1% rule.
- Local home prices are declining (-3.0%/yr); year-one equity from $2k of loan paydown is wiped out by about $7k of value loss. Plan a longer hold.
- Location reads 77/100 on livability (#88 in VA, #2,896 nationally) — a middle-class / working-renter tenant base. Strengths: housing A+, health & safety A+, employment A-; Watch: crime C-, commute F.
- Suffolk City Public School District (suburban): math 41% / reading 69% proficiency, ranked #72 of 131 in VA (top 55%) — acceptable for families but not a draw, mixed tenant base, ~2y average lease.
- Zoned schools: Florence Bowser Elementary (math 52% / reading 75%, grade B, #460 of 1,108 statewide, top 42%, 831 students, 64% FRL); King'S Fork Middle (math 33% / reading 61%, grade D+, #257 of 342 statewide, top 77%, 1,031 students, 63% FRL); King'S Fork High (math 44% / reading 77%, grade C+, #244 of 319 statewide, top 77%, 1,697 students, 63% FRL) — zoned schools average 64% FRL vs 39% district-wide (24 pts higher); higher-poverty schools than district average — tighter screening recommended.
- Watch-outs: built in 1947 — expect roof / HVAC / electrical / plumbing capex.
- Market conditions: Rents rising fast (+5.8%/yr); 546 active listings in the ZIP; 11 comparable units currently listed for rent nearby; rentals at typical pace (median 26d on market — plan ~3-4 weeks tenant-placement turnaround); solid renter incomes; 680 units permitted in Suffolk city in 2024 (0 in 5+ unit buildings).
- Suffolk County population projected at +11% by 2050 — modest demand growth; plan on rents tracking national, not racing it.
- 4 sale attempts since 8y ago with the ask held roughly flat each time — persistent listings suggest the price (not the market) is what's stuck; bring a comps-based counter.
- Climate carrying-cost: severe wind risk, 80% chance of damaging wind over 30y; extreme-heat days projected 7→16/yr by 2055 (HVAC capex compounding) — expect insurance premiums to compound above CPI over the hold.
- Cap rate 6.0% vs local median 3.5% in Suffolk — top-decile yield for the area; either an underpriced asset or a hidden risk that comps aren't pricing in. Stress-test before assuming the spread holds.
Questions for listing agent
- What do current leases actually rent for vs. the listed asking? Can we see a recent rent roll and the last 12 months of T-12 income?
- Built in 1947 — when were the roof, HVAC, electrical panel, plumbing, and water heater last replaced?
- Is there a deadline driving the sale (1031 exchange, divorce, estate, relocation)? That informs how much negotiation room exists.
- Schools are A-rated — typically a magnet for longer-tenancy family renters. What's the average tenant stay here, and is there a school-zone premium baked into asking?
- The area grade is low — what's the realistic commute time and amenity access for the typical tenant pool here? Any planned neighborhood developments (good or bad) we should know about?
- What's the average days-on-market for RENTAL listings here right now (not sales)? A rising rental-DOM trend means longer vacancies and softer asking-rent achievability than the comps imply.
- What's the recent tenant-quality profile in this submarket — average credit score on applications, eviction rate, late-payment / NSF rate, and stable-employment percentage? A property-management company in the area should have these aggregated.
- How much new for-sale + rental construction is in the pipeline within 1–3 miles? Heavy new supply typically softens prices + rents 12–24 months out; constrained supply supports both.
CashFlowRE · CFR-VK6BTC1A0WJ351
· Data 4 days ago
cashflowre.app · 2026-05-29