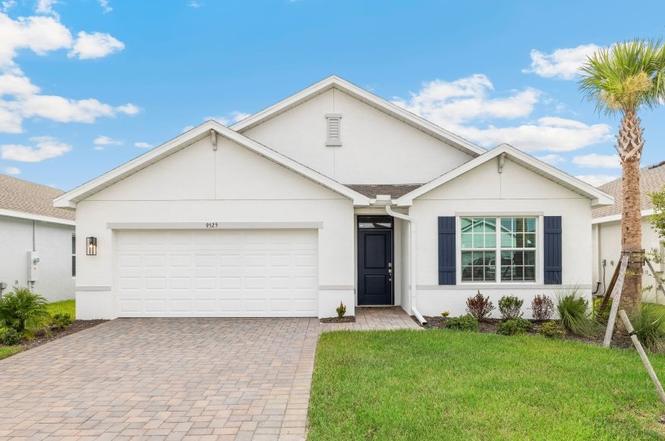
9486 Turtle Grass Cir
Punta Gorda, FL 33950
$299,999D-
4 bd · 2.0 ba ·
1,828 sqft ·
Built 2025
· Land
· Active
· 170 DOM
Cashflow @ list (25.0% down · 7.5%)
Estimated rent
$2,548/mo
Mortgage (P&I)
−$1,573
Tax + insurance
−$403
HOA
−$180
Vac / Maint / Mgmt
−$535
Net cashflow
$-143/mo
Annual
$-1,714/yr
Cap rate
5.72%
Cash-on-cash
-2.04%
DSCR
0.91
1% rule
0.85%
Cash to close
$84,000
Investor read
- This is a 4-bed/2.0-bath land listed at $300k.
- At list price, monthly cash flow is $-143 ($-2k/yr) — negative.
- To cash-flow at today's rent, offer at most $275k (8.4% below list).
- To meet the 1% rule (rent ≥ 1% of price), the offer needs to be $255k (15.1% below list).
- It's been on market 170 days — a 12% lower offer ($264k) is reasonable based on typical stale-listing flexibility.
- Recommended offer: $255k (15.1% below list) — sets the bar for 1% rule.
- Local home prices are declining (-3.0%/yr); year-one equity from $2k of loan paydown is wiped out by about $9k of value loss. Plan a longer hold.
- Location reads 76/100 on livability (#225 in FL, #3,567 nationally) — a middle-class / working-renter tenant base. Strengths: crime A+, health & safety A+, housing B; Watch: cost of living D+, amenities D-, commute F.
- Charlotte (suburban): math 54% / reading 54% proficiency, ranked #22 of 73 in FL (top 30%) — acceptable for families but not a draw, mixed tenant base, ~2y average lease.
- Zoned schools: Sallie Jones Elementary School (math 75% / reading 74%, grade A, #230 of 2,144 statewide, top 12%, 694 students, 47% FRL); Charlotte High School (math 44% / reading 46%, grade D-, #228 of 667 statewide, top 35%, 1,994 students, 41% FRL).
- Market conditions: Rents soft (-0.1%/yr); 999 active listings in the ZIP; 7 comparable units currently listed for rent nearby; rentals at typical pace (median 21d on market — plan ~3-4 weeks tenant-placement turnaround); solid renter incomes; 4,585 units permitted in Charlotte County in 2024 (703 in 5+ unit buildings).
- Charlotte County population projected at +24% by 2050 — long-run rental-demand tailwind backs the buy-and-hold thesis.
- 2 sale attempts; this cycle's ask has dropped $42k (12%) from the opening price — seller is motivated, your offer sets the floor, not the list.
- Cap rate 5.7% vs local median 2.8% in Punta Gorda — top-decile yield for the area; either an underpriced asset or a hidden risk that comps aren't pricing in. Stress-test before assuming the spread holds.
- This rent runs 40% of the median local income ($76k/yr) — at the standard rent-burdened threshold; future hikes will face affordability resistance.
Questions for listing agent
- What do current leases actually rent for vs. the listed asking? Can we see a recent rent roll and the last 12 months of T-12 income?
- It's been on market 170 days. Have you received any prior offers? Is the seller open to a 15% concession, seller financing, or rate buy-down credit?
- What does the HOA fee cover, when was the last increase, and are there any pending special assessments or reserve-fund shortfalls?
- Why hasn't it sold? Are there any deal-killer items the seller is aware of (foundation, flood, title, zoning, code violations)?
- Is there a deadline driving the sale (1031 exchange, divorce, estate, relocation)? That informs how much negotiation room exists.
- Schools are A-rated — typically a magnet for longer-tenancy family renters. What's the average tenant stay here, and is there a school-zone premium baked into asking?
- The area grade is low — what's the realistic commute time and amenity access for the typical tenant pool here? Any planned neighborhood developments (good or bad) we should know about?
- What's the average days-on-market for RENTAL listings here right now (not sales)? A rising rental-DOM trend means longer vacancies and softer asking-rent achievability than the comps imply.
CashFlowRE · CFR-VMW7ND2PDA48AA
· Data 2 days ago
cashflowre.app · 2026-05-29