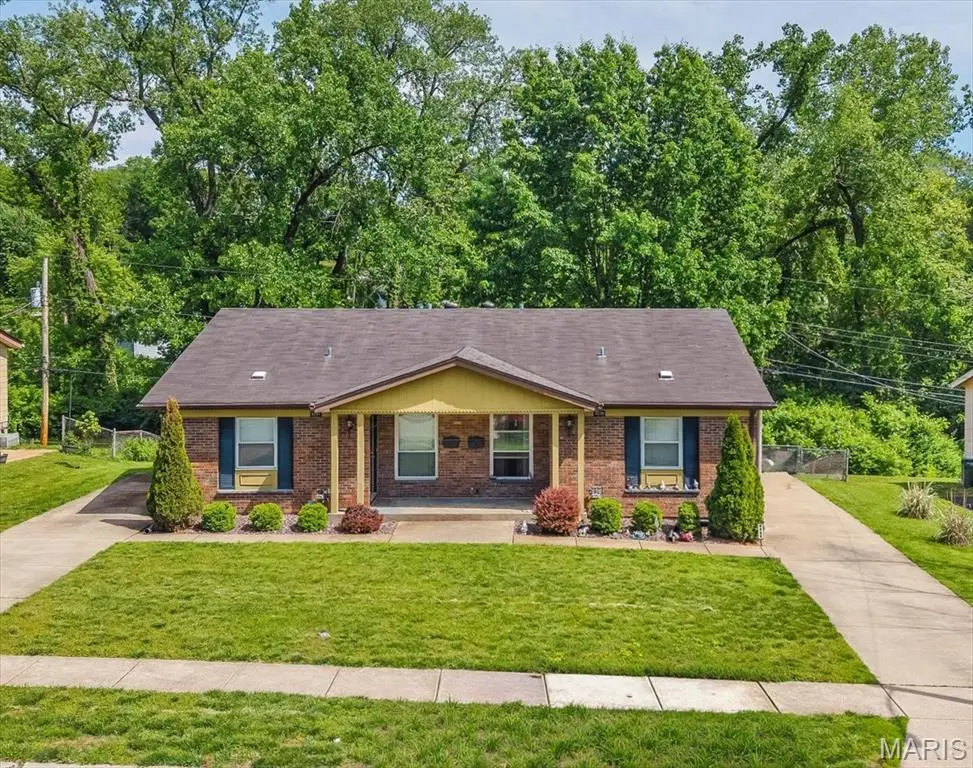
5239 Ville Anita Ct
Hazelwood, MO 63042
$260,000B-
6 bd · 2.0 ba ·
1,820 sqft ·
Built 1968
· MultiFamily
· Pending
· 27 DOM
Cashflow @ list (25.0% down · 7.5%)
Estimated rent
$2,961/mo
Mortgage (P&I)
−$1,363
Tax + insurance
−$294
HOA
−$0
Vac / Maint / Mgmt
−$622
Net cashflow
$682/mo
Annual
$8,187/yr
Cap rate
9.44%
Cash-on-cash
11.25%
DSCR
1.50
1% rule
1.14%
Cash to close
$72,800
Investor read
- This is a 2 × 3-bed/1.0-bath units multifamily listed at $260k.
- At list price, monthly cash flow is $682 ($8k/yr) — positive. Per door: $341/mo.
- The deal already cash-flows at list — no discount required.
- Meets the 1% rule at list price ($3k rent vs $260k).
- It's been on market 27 days — a 2% lower offer ($256k) is reasonable based on typical stale-listing flexibility.
- Recommended offer: $256k (1.5% below list) — sets the bar for market timing.
- Local home prices are declining (-3.0%/yr); year-one equity from $2k of loan paydown is wiped out by about $8k of value loss. Plan a longer hold.
- Location reads 62/100 on livability (#395 in MO) — a middle-class / working-renter tenant base. Strengths: cost of living A+, housing A+; Watch: schools D-, crime F, amenities F.
- Ferguson-Florissant R-II (suburban): math 7% / reading 20% proficiency, ranked #311 of 324 in MO (top 96%) — low school quality limits family demand, transient renter base, plan for 1-2y turnover; 70% free/reduced lunch — lower-income household profile, screen leases tightly.
- Market conditions: Rents rising fast (+4.5%/yr); 68 active listings in the ZIP; 920 units permitted in St. Louis County in 2024 (250 in 5+ unit buildings).
- 2 sale attempts since 12y ago with the ask held roughly flat each time — persistent listings suggest the price (not the market) is what's stuck; bring a comps-based counter.
- Current owner paid $50k; list at $260k implies a 420% gain — meaningful room to come down on a strong offer.
- At projected returns (-3.0% appreciation + 4.5% rent growth), your $73k cash investment doubles in ~9 years — after that, you're playing with house money.
- Cap rate 9.4% vs local median 7.2% in Hazelwood — top-decile yield for the area; either an underpriced asset or a hidden risk that comps aren't pricing in. Stress-test before assuming the spread holds.
- At $2,961/mo this rent would consume 72% of the median local household income ($49k/yr) (locally 766% of renters already pay >50% of income on rent) — very limited rent-growth headroom before tenants either downsize or default.
Questions for listing agent
- Can we see the unit-by-unit rent roll, current vacancy, and any below-market leases? What's the average tenancy length?
- What capital expenditures (roof, boiler, parking lot, exteriors) have been made in the last 5 years, and what's planned in the next 2?
- Built in 1968 — when were the roof, HVAC, electrical panel, plumbing, and water heater last replaced?
- Is there a deadline driving the sale (1031 exchange, divorce, estate, relocation)? That informs how much negotiation room exists.
- Schools are D-rated, which usually means shorter tenancies and higher turnover. Who's the typical renter profile here, and what's been the actual vacancy rate?
- Crime grade is F in this area — have there been break-ins, vandalism, or insurance claims at this property in the last 3 years? What carrier currently insures it and at what premium?
- What's the average days-on-market for RENTAL listings here right now (not sales)? A rising rental-DOM trend means longer vacancies and softer asking-rent achievability than the comps imply.
- What's the recent tenant-quality profile in this submarket — average credit score on applications, eviction rate, late-payment / NSF rate, and stable-employment percentage? A property-management company in the area should have these aggregated.
CashFlowRE · CFR-VP4WN57214YGTY
· Data 1 week ago
cashflowre.app · 2026-05-29