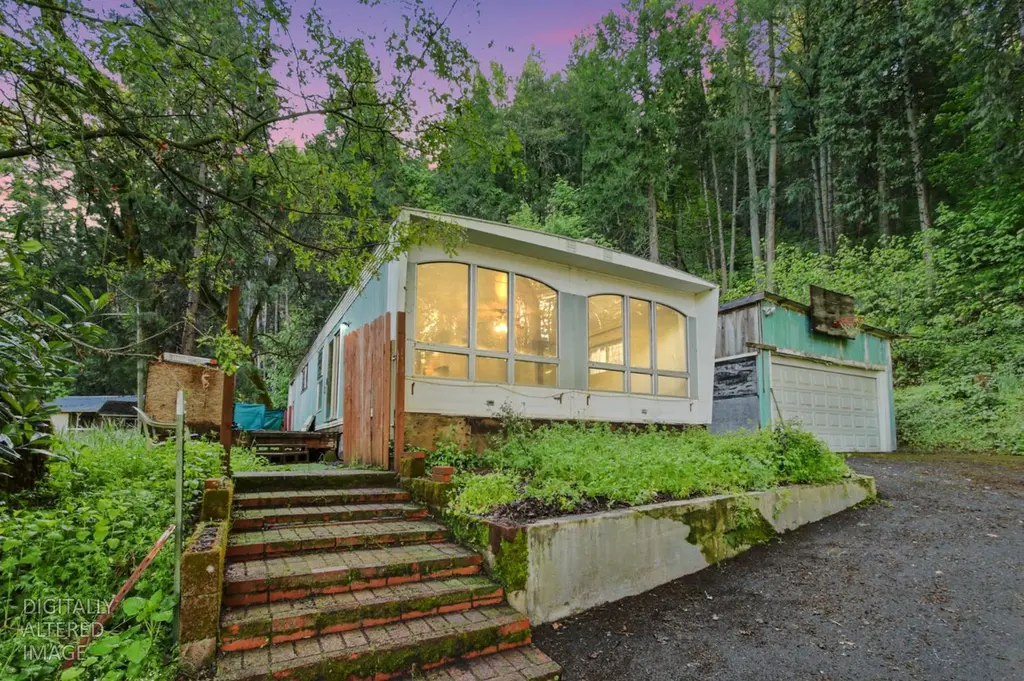
4641 Meadland Dr
Camino, CA 95667
$150,000B-
2 bd · 1.0 ba ·
1,000 sqft ·
Built 1964
· Land
· Pending
· 10 DOM
Cashflow @ list (25.0% down · 7.5%)
Estimated rent
$1,828/mo
Mortgage (P&I)
−$787
Tax + insurance
−$214
HOA
−$0
Vac / Maint / Mgmt
−$384
Net cashflow
$443/mo
Annual
$5,322/yr
Cap rate
10.37%
Cash-on-cash
14.57%
DSCR
1.65
1% rule
1.22%
Cash to close
$42,000
Investor read
- This is a 2-bed/1.0-bath land listed at $150k.
- At list price, monthly cash flow is $443 ($5k/yr) — positive.
- The deal already cash-flows at list — no discount required.
- Meets the 1% rule at list price ($2k rent vs $150k).
- Only 10 days on market — expect competitive offers; lowballing is unlikely to land.
- Local home prices are declining (-3.0%/yr); year-one equity from $1k of loan paydown is wiped out by about $4k of value loss. Plan a longer hold.
- Location reads 62/100 on livability (#480 in CA) — a middle-class / working-renter tenant base. Strengths: crime A+, employment A+, housing A+; Watch: amenities F, commute F, cost of living F.
- Gold Oak Union Elementary (rural): math 25% / reading 44% proficiency, ranked #262 of 517 in CA (top 51%) — families likely to look elsewhere, expect single-tenant / working-renter base with shorter leases.
- Zoned schools: Gold Oak Elementary (math 32% / reading 47%, grade F, #621 of 1,571 statewide, top 42%, 311 students, 39% FRL); Pleasant Valley Middle (math 17% / reading 37%, grade F, #242 of 498 statewide, top 50%, 155 students, 39% FRL); El Dorado High (math 30% / reading 60%, grade D-, #425 of 1,170 statewide, top 37%, 1,224 students, 30% FRL).
- Watch-outs: flood insurance adds $66/mo.
- Market conditions: Rents rising fast (+12.5%/yr); 352 active listings in the ZIP; solid renter incomes; 437 units permitted in El Dorado County in 2024 (0 in 5+ unit buildings).
- El Dorado County population projected to shrink 3% by 2050 — rents likely to lag national; underwrite the cash flow, not the appreciation.
- Current owner paid $80k; list at $150k implies a 88% gain — meaningful room to come down on a strong offer.
- At projected returns (-3.0% appreciation + 8.0% rent growth), your $42k cash investment doubles in ~7 years — after that, you're playing with house money.
- Climate carrying-cost: severe flood risk; severe wildfire risk; extreme-heat days projected 7→16/yr by 2055 (HVAC capex compounding) — expect insurance premiums to compound above CPI over the hold.
- Cap rate 10.4% vs local median 2.5% in Camino — top-decile yield for the area; either an underpriced asset or a hidden risk that comps aren't pricing in. Stress-test before assuming the spread holds.
Questions for listing agent
- Built in 1964 — when were the roof, HVAC, electrical panel, plumbing, and water heater last replaced?
- What's the actual annual flood-insurance premium (NFIP or private), and is the property in a SFHA with mandatory coverage?
- Is there a deadline driving the sale (1031 exchange, divorce, estate, relocation)? That informs how much negotiation room exists.
- Schools are B-rated — typically a magnet for longer-tenancy family renters. What's the average tenant stay here, and is there a school-zone premium baked into asking?
- What's the average days-on-market for RENTAL listings here right now (not sales)? A rising rental-DOM trend means longer vacancies and softer asking-rent achievability than the comps imply.
- What's the recent tenant-quality profile in this submarket — average credit score on applications, eviction rate, late-payment / NSF rate, and stable-employment percentage? A property-management company in the area should have these aggregated.
- How much new for-sale + rental construction is in the pipeline within 1–3 miles? Heavy new supply typically softens prices + rents 12–24 months out; constrained supply supports both.
CashFlowRE · CFR-VQXBQV5G12M42Z
· Data 2 weeks ago
cashflowre.app · 2026-05-29