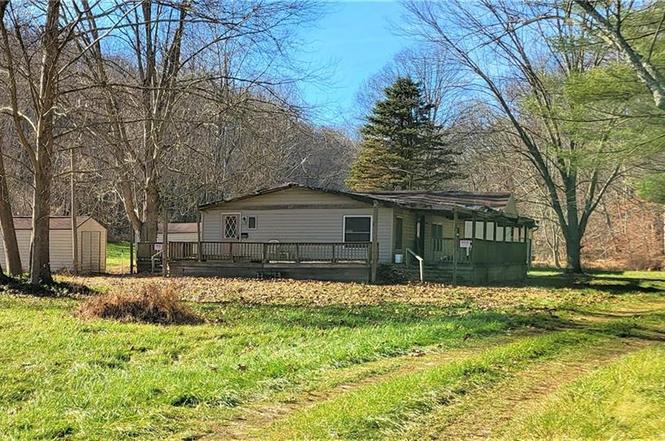
1348 State Road 135 S
Nashville, IN 47448
$139,900C+
1 bd · 2.0 ba ·
1,248 sqft ·
Built 1989
· Manufactured
· Active
· 104 DOM
Cashflow @ list (25.0% down · 7.5%)
Estimated rent
$1,609/mo
Mortgage (P&I)
−$734
Tax + insurance
−$99
HOA
−$0
Vac / Maint / Mgmt
−$338
Net cashflow
$439/mo
Annual
$5,269/yr
Cap rate
10.06%
Cash-on-cash
13.45%
DSCR
1.60
1% rule
1.15%
Cash to close
$39,172
Investor read
- This is a 1-bed/2.0-bath manufactured listed at $140k.
- At list price, monthly cash flow is $439 ($5k/yr) — positive.
- The deal already cash-flows at list — no discount required.
- Meets the 1% rule at list price ($2k rent vs $140k).
- It's been on market 104 days — a 9% lower offer ($127k) is reasonable based on typical stale-listing flexibility.
- Recommended offer: $127k (9.0% below list) — sets the bar for market timing.
- Local home prices are declining (-3.0%/yr); year-one equity from $967 of loan paydown is wiped out by about $4k of value loss. Plan a longer hold.
- Location reads 80/100 on livability (#20 in IN, #1,893 nationally) — a professional / high-income tenant draw. Strengths: crime A+, cost of living A+, housing A+; Watch: employment D+, amenities F, commute F.
- Brown County School Corporation (rural): math 37% / reading 48% proficiency, ranked #113 of 301 in IN (top 38%) — families likely to look elsewhere, expect single-tenant / working-renter base with shorter leases.
- Zoned schools: Van Buren Elementary School (math 47% / reading 47%, grade D-, #325 of 994 statewide, top 36%, 245 students, 43% FRL); Brown County High School (math 27% / reading 67%, grade D-, #143 of 369 statewide, top 44%, 509 students, 48% FRL) — zoned schools at 46% FRL track the district average.
- Market conditions: 90 active listings in the ZIP; 76 units permitted in Brown County in 2024 (0 in 5+ unit buildings).
- Brown County population projected at -12% by 2050 — secular population decline; favor cash flow + early exit over multi-decade hold.
- 3 sale attempts since 5y ago; this cycle's ask has dropped $10k (7%) from the opening price — seller is motivated, your offer sets the floor, not the list.
- Current owner paid $86k; list at $140k implies a 63% gain — meaningful room to come down on a strong offer.
- At projected returns (-3.0% appreciation + 3.0% rent growth), your $39k cash investment doubles in ~9 years — after that, you're playing with house money.
- Cap rate 10.1% vs local median 2.9% in Nashville — top-decile yield for the area; either an underpriced asset or a hidden risk that comps aren't pricing in. Stress-test before assuming the spread holds.
Questions for listing agent
- It's been on market 104 days. Have you received any prior offers? Is the seller open to a 9% concession, seller financing, or rate buy-down credit?
- Why hasn't it sold? Are there any deal-killer items the seller is aware of (foundation, flood, title, zoning, code violations)?
- Is there a deadline driving the sale (1031 exchange, divorce, estate, relocation)? That informs how much negotiation room exists.
- What's the average days-on-market for RENTAL listings here right now (not sales)? A rising rental-DOM trend means longer vacancies and softer asking-rent achievability than the comps imply.
- What's the recent tenant-quality profile in this submarket — average credit score on applications, eviction rate, late-payment / NSF rate, and stable-employment percentage? A property-management company in the area should have these aggregated.
- How much new for-sale + rental construction is in the pipeline within 1–3 miles? Heavy new supply typically softens prices + rents 12–24 months out; constrained supply supports both.
CashFlowRE · CFR-VR1D8S9ZAZ02EE
· Data 2 weeks ago
cashflowre.app · 2026-05-29