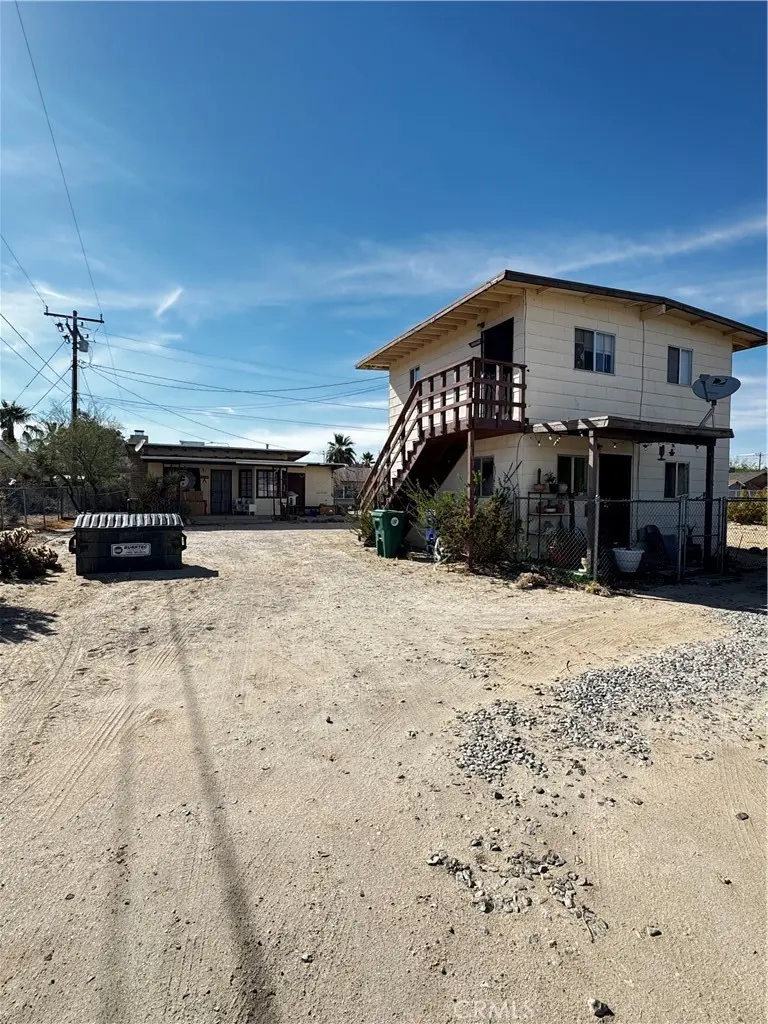
6666 Cholla
Twentynine Palms, CA 92277
$299,000C-
3 bd · 3.0 ba ·
1,000 sqft ·
Built 1955
· MultiFamily
· Active
· 84 DOM
Cashflow @ list (25.0% down · 7.5%)
Estimated rent
$3,344/mo
Mortgage (P&I)
−$1,568
Tax + insurance
−$362
HOA
−$0
Vac / Maint / Mgmt
−$702
Net cashflow
$712/mo
Annual
$8,541/yr
Cap rate
9.64%
Cash-on-cash
11.95%
DSCR
1.53
1% rule
1.12%
Cash to close
$83,720
Investor read
- This is a 3-bed/3.0-bath multifamily listed at $299k.
- At list price, monthly cash flow is $712 ($9k/yr) — positive.
- The deal already cash-flows at list — no discount required.
- Meets the 1% rule at list price ($3k rent vs $299k).
- It's been on market 84 days — a 6% lower offer ($281k) is reasonable based on typical stale-listing flexibility.
- Recommended offer: $281k (6.0% below list) — sets the bar for market timing.
- Local home prices are declining (-3.0%/yr); year-one equity from $2k of loan paydown is wiped out by about $9k of value loss. Plan a longer hold.
- Location reads 59/100 on livability (#622 in CA) — a working-class tenant base; expect higher turnover. Strengths: commute A+, housing A+; Watch: schools D, amenities F, employment D-.
- Morongo Unified (town): math 15% / reading 38% proficiency, ranked #395 of 517 in CA (top 76%) — low school quality limits family demand, transient renter base, plan for 1-2y turnover.
- Watch-outs: flood insurance adds $122/mo; built in 1955 — expect roof / HVAC / electrical / plumbing capex.
- Market conditions: Rents rising fast (+4.5%/yr); 734 active listings in the ZIP; 32 comparable units currently listed for rent nearby; rentals at typical pace (median 25d on market — plan ~3-4 weeks tenant-placement turnaround); 5,458 units permitted in San Bernardino County in 2024 (1,500 in 5+ unit buildings).
- San Bernardino County population projected at +15% by 2050 — modest demand growth; plan on rents tracking national, not racing it.
- Current owner paid $48k; list at $299k implies a 523% gain — meaningful room to come down on a strong offer.
- At projected returns (-3.0% appreciation + 4.5% rent growth), your $84k cash investment doubles in ~10 years — after that, you're playing with house money.
- Climate carrying-cost: in FEMA flood zone AO (mandatory federal flood insurance); extreme-heat days projected 9→24/yr by 2055 (HVAC capex compounding) — expect insurance premiums to compound above CPI over the hold.
- Cap rate 9.6% vs local median 4.3% in Twentynine Palms — top-decile yield for the area; either an underpriced asset or a hidden risk that comps aren't pricing in. Stress-test before assuming the spread holds.
- At $3,344/mo this rent would consume 66% of the median local household income ($61k/yr) (locally 1057% of renters already pay >50% of income on rent) — very limited rent-growth headroom before tenants either downsize or default.
Questions for listing agent
- It's been on market 84 days. Have you received any prior offers? Is the seller open to a 6% concession, seller financing, or rate buy-down credit?
- Built in 1955 — when were the roof, HVAC, electrical panel, plumbing, and water heater last replaced?
- What's the actual annual flood-insurance premium (NFIP or private), and is the property in a SFHA with mandatory coverage?
- Why hasn't it sold? Are there any deal-killer items the seller is aware of (foundation, flood, title, zoning, code violations)?
- Is there a deadline driving the sale (1031 exchange, divorce, estate, relocation)? That informs how much negotiation room exists.
- Schools are D-rated, which usually means shorter tenancies and higher turnover. Who's the typical renter profile here, and what's been the actual vacancy rate?
- What's the average days-on-market for RENTAL listings here right now (not sales)? A rising rental-DOM trend means longer vacancies and softer asking-rent achievability than the comps imply.
- What's the recent tenant-quality profile in this submarket — average credit score on applications, eviction rate, late-payment / NSF rate, and stable-employment percentage? A property-management company in the area should have these aggregated.
CashFlowRE · CFR-VSXBV78QEWF2MA
· Data 2 days ago
cashflowre.app · 2026-05-29