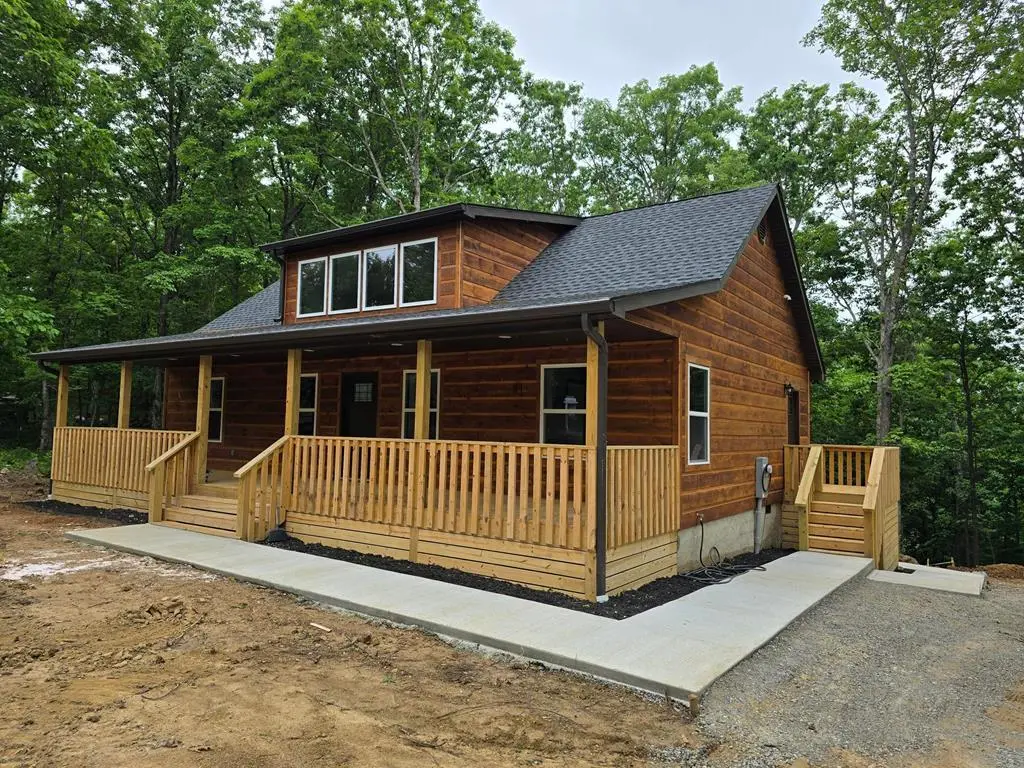
2377 Porch Rock Rd
Pikeville, TN 37367
$339,900D-
2 bd · 2.0 ba ·
1,308 sqft ·
Built 2026
· SingleFamily
· Active
· 20 DOM
Cashflow @ list (25.0% down · 7.5%)
Estimated rent
$2,462/mo
Mortgage (P&I)
−$1,782
Tax + insurance
−$566
HOA
−$0
Vac / Maint / Mgmt
−$517
Net cashflow
$-404/mo
Annual
$-4,846/yr
Cap rate
4.87%
Cash-on-cash
-5.09%
DSCR
0.77
1% rule
0.72%
Cash to close
$95,172
Investor read
- This is a 2-bed/2.0-bath single-family listed at $340k.
- At list price, monthly cash flow is $-404 ($-5k/yr) — negative.
- To cash-flow at today's rent, offer at most $281k (17.2% below list).
- To meet the 1% rule (rent ≥ 1% of price), the offer needs to be $246k (27.6% below list).
- It's been on market 20 days — a 2% lower offer ($335k) is reasonable based on typical stale-listing flexibility.
- Recommended offer: $246k (27.6% below list) — sets the bar for 1% rule.
- In year one you build about $36k of equity ($2k loan paydown + $34k appreciation (10.0% local appreciation)).
- Location reads 59/100 on livability (#296 in TN) — a working-class tenant base; expect higher turnover. Strengths: cost of living A+, crime A, housing B+; Watch: health & safety C-, amenities F, commute F.
- Bledsoe County (rural): math 19% / reading 27% proficiency, ranked #104 of 139 in TN (top 75%) — low school quality limits family demand, transient renter base, plan for 1-2y turnover; 69% free/reduced lunch — lower-income household profile, screen leases tightly.
- Zoned schools: Pikeville Elementary (math 27% / reading 32%, grade F, #423 of 952 statewide, top 48%, 415 students, 0% FRL); Bledsoe County High School (math 2% / reading 32%, grade F, #215 of 332 statewide, top 67%, 483 students, 0% FRL) — zoned schools average 0% FRL vs 69% district-wide (69 pts lower); this property's tenant base skews higher-income than the district average.
- Market conditions: 155 active listings in the ZIP.
- Bledsoe County population projected at +36% by 2050 — long-run rental-demand tailwind backs the buy-and-hold thesis.
- 4 sale attempts with the ask held roughly flat each time — persistent listings suggest the price (not the market) is what's stuck; bring a comps-based counter.
- By year 2, paydown + projected appreciation supports a ~$58k cash-out refi (75% LTV) — recoverable capital for the next deal without selling this one.
- Climate carrying-cost: moderate wildfire risk — expect insurance premiums to compound above CPI over the hold.
- At $2,462/mo this rent would consume 54% of the median local household income ($55k/yr) — very limited rent-growth headroom before tenants either downsize or default.
Questions for listing agent
- What do current leases actually rent for vs. the listed asking? Can we see a recent rent roll and the last 12 months of T-12 income?
- Is there a deadline driving the sale (1031 exchange, divorce, estate, relocation)? That informs how much negotiation room exists.
- Schools are F-rated, which usually means shorter tenancies and higher turnover. Who's the typical renter profile here, and what's been the actual vacancy rate?
- The area grade is low — what's the realistic commute time and amenity access for the typical tenant pool here? Any planned neighborhood developments (good or bad) we should know about?
- What's the average days-on-market for RENTAL listings here right now (not sales)? A rising rental-DOM trend means longer vacancies and softer asking-rent achievability than the comps imply.
- What's the recent tenant-quality profile in this submarket — average credit score on applications, eviction rate, late-payment / NSF rate, and stable-employment percentage? A property-management company in the area should have these aggregated.
- How much new for-sale + rental construction is in the pipeline within 1–3 miles? Heavy new supply typically softens prices + rents 12–24 months out; constrained supply supports both.
CashFlowRE · CFR-VVTZ2FBJAH1VF0
· Data 2 days ago
cashflowre.app · 2026-05-29