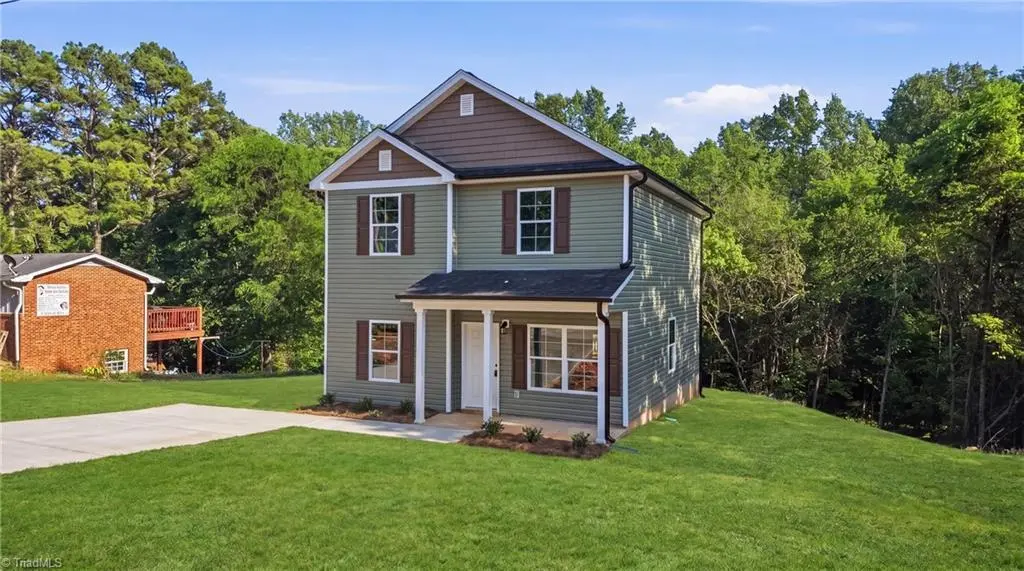
1103 Craver Dr
Lexington, NC 27292
$239,990F
3 bd · 1.0 ba ·
810 sqft ·
Built 2026
· SingleFamily
· Pending
· 40 DOM
Cashflow @ list (25.0% down · 7.5%)
Estimated rent
$1,281/mo
Mortgage (P&I)
−$1,259
Tax + insurance
−$155
HOA
−$0
Vac / Maint / Mgmt
−$269
Net cashflow
$-402/mo
Annual
$-4,822/yr
Cap rate
4.28%
Cash-on-cash
-7.18%
DSCR
0.68
1% rule
0.53%
Cash to close
$67,197
Investor read
- This is a 3-bed/1.0-bath single-family listed at $240k.
- At list price, monthly cash flow is $-402 ($-5k/yr) — negative.
- To cash-flow at today's rent, offer at most $169k (29.6% below list).
- To meet the 1% rule (rent ≥ 1% of price), the offer needs to be $128k (46.6% below list).
- It's been on market 40 days — a 3% lower offer ($233k) is reasonable based on typical stale-listing flexibility.
- Recommended offer: $128k (46.6% below list) — sets the bar for 1% rule.
- Local home prices are declining (-3.0%/yr); year-one equity from $2k of loan paydown is wiped out by about $7k of value loss. Plan a longer hold.
- Location reads 72/100 on livability (#89 in NC) — a middle-class / working-renter tenant base. Strengths: commute A+, cost of living A+, health & safety A+; Watch: schools D, crime F, amenities D-.
- Lexington City Schools (suburban): math 32% / reading 38% proficiency, ranked #136 of 178 in NC (top 76%) — families likely to look elsewhere, expect single-tenant / working-renter base with shorter leases; 78% free/reduced lunch — lower-income household profile, screen leases tightly.
- Market conditions: Rents rising (+1.4%/yr); 400 active listings in the ZIP; 6 comparable units currently listed for rent nearby; rentals at typical pace (median 15d on market — plan ~3-4 weeks tenant-placement turnaround); 990 units permitted in Davidson County in 2024 (54 in 5+ unit buildings).
- Davidson County population projected to shrink 6% by 2050 — rents likely to lag national; underwrite the cash flow, not the appreciation.
- Current owner paid $18k; list at $240k implies a 1233% gain — meaningful room to come down on a strong offer.
- Climate carrying-cost: extreme-heat days projected 7→17/yr by 2055 (HVAC capex compounding) — expect insurance premiums to compound above CPI over the hold.
- Cap rate 4.3% vs local median 3.5% in Lexington — meaningfully above typical; check what's discounted (condition, days-on-market, listing class) to confirm the premium yield is real.
Questions for listing agent
- What do current leases actually rent for vs. the listed asking? Can we see a recent rent roll and the last 12 months of T-12 income?
- It's been on market 40 days. Have you received any prior offers? Is the seller open to a 47% concession, seller financing, or rate buy-down credit?
- Is there a deadline driving the sale (1031 exchange, divorce, estate, relocation)? That informs how much negotiation room exists.
- Schools are D-rated, which usually means shorter tenancies and higher turnover. Who's the typical renter profile here, and what's been the actual vacancy rate?
- Crime grade is F in this area — have there been break-ins, vandalism, or insurance claims at this property in the last 3 years? What carrier currently insures it and at what premium?
- The area grade is low — what's the realistic commute time and amenity access for the typical tenant pool here? Any planned neighborhood developments (good or bad) we should know about?
- What's the average days-on-market for RENTAL listings here right now (not sales)? A rising rental-DOM trend means longer vacancies and softer asking-rent achievability than the comps imply.
- What's the recent tenant-quality profile in this submarket — average credit score on applications, eviction rate, late-payment / NSF rate, and stable-employment percentage? A property-management company in the area should have these aggregated.
CashFlowRE · CFR-VVVN1RAW5MBYPF
· Data 2 weeks ago
cashflowre.app · 2026-05-29