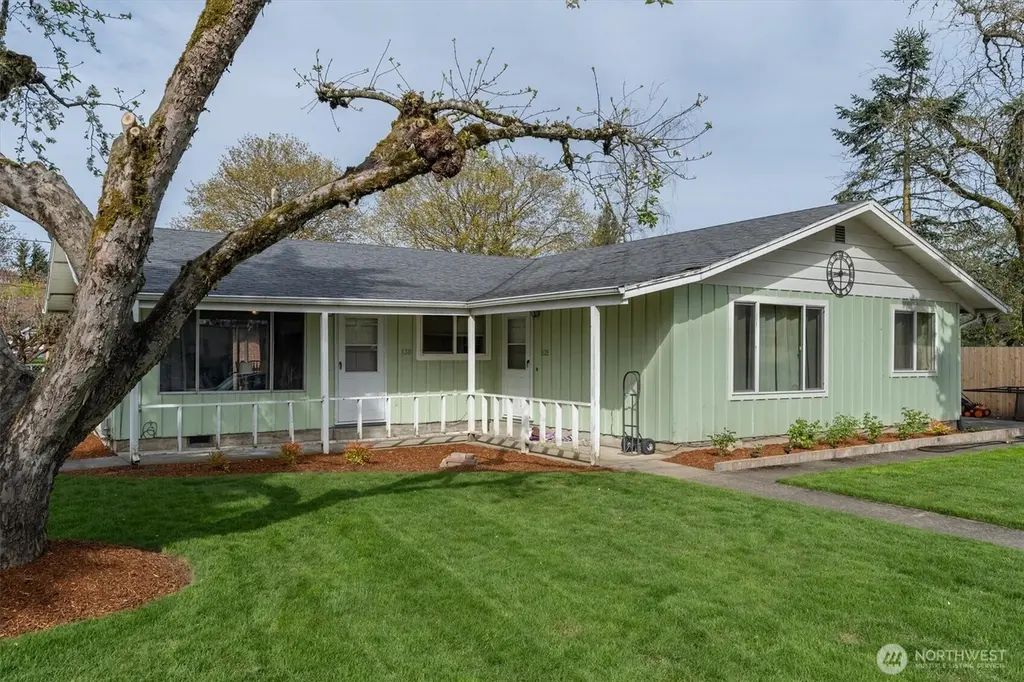
128 Robbins St
Woodland, WA 98674
$375,000C-
4 bd · 2.0 ba ·
1,632 sqft ·
Built 1963
· MultiFamily
· Pending
· 4 DOM
Cashflow @ list (25.0% down · 7.5%)
Estimated rent
$3,526/mo
Mortgage (P&I)
−$1,967
Tax + insurance
−$451
HOA
−$0
Vac / Maint / Mgmt
−$740
Net cashflow
$368/mo
Annual
$4,419/yr
Cap rate
7.47%
Cash-on-cash
4.21%
DSCR
1.19
1% rule
0.94%
Cash to close
$105,000
Investor read
- This is a 2 × 2-bed/1.0-bath units multifamily listed at $375k.
- At list price, monthly cash flow is $368 ($4k/yr) — positive. Per door: $184/mo.
- The deal already cash-flows at list — no discount required.
- To meet the 1% rule (rent ≥ 1% of price), the offer needs to be $353k (6.0% below list).
- Only 4 days on market — expect competitive offers; lowballing is unlikely to land.
- Recommended offer: $353k (6.0% below list) — sets the bar for 1% rule.
- Local home prices are declining (-3.0%/yr); year-one equity from $3k of loan paydown is wiped out by about $11k of value loss. Plan a longer hold.
- Location reads 77/100 on livability (#152 in WA, #3,252 nationally) — a middle-class / working-renter tenant base. Strengths: housing A+, health & safety A+, amenities B+; Watch: commute F.
- Woodland School District (town): math 48% / reading 62% proficiency, ranked #94 of 291 in WA (top 32%) — acceptable for families but not a draw, mixed tenant base, ~2y average lease.
- Zoned schools: Yale Elementary (54 students, 50% FRL); Woodland High School (658 students, 42% FRL).
- Market conditions: 220 active listings in the ZIP; solid renter incomes; 348 units permitted in Cowlitz County in 2024 (40 in 5+ unit buildings).
- Cowlitz County population projected to shrink 8% by 2050 — rents likely to lag national; underwrite the cash flow, not the appreciation.
- 6 sale attempts since 26y ago with the ask held roughly flat each time — persistent listings suggest the price (not the market) is what's stuck; bring a comps-based counter.
- Current owner paid $281k; 33% above their basis — modest negotiation headroom, anchor on the comps not their cost.
- Cap rate 7.5% vs local median 2.7% in Woodland — top-decile yield for the area; either an underpriced asset or a hidden risk that comps aren't pricing in. Stress-test before assuming the spread holds.
- This rent runs 45% of the median local income ($94k/yr) — at the standard rent-burdened threshold; future hikes will face affordability resistance.
Questions for listing agent
- Can we see the unit-by-unit rent roll, current vacancy, and any below-market leases? What's the average tenancy length?
- What capital expenditures (roof, boiler, parking lot, exteriors) have been made in the last 5 years, and what's planned in the next 2?
- Built in 1963 — when were the roof, HVAC, electrical panel, plumbing, and water heater last replaced?
- Is there a deadline driving the sale (1031 exchange, divorce, estate, relocation)? That informs how much negotiation room exists.
- Schools are D-rated, which usually means shorter tenancies and higher turnover. Who's the typical renter profile here, and what's been the actual vacancy rate?
- What's the average days-on-market for RENTAL listings here right now (not sales)? A rising rental-DOM trend means longer vacancies and softer asking-rent achievability than the comps imply.
- What's the recent tenant-quality profile in this submarket — average credit score on applications, eviction rate, late-payment / NSF rate, and stable-employment percentage? A property-management company in the area should have these aggregated.
- How much new apartment / multifamily construction is in the pipeline within 1–3 miles? Heavy new supply (>2% of stock underway) typically softens rents 12–24 months out; light construction supports rent growth.
CashFlowRE · CFR-VW7YA488RSEVXJ
· Data 3 weeks ago
cashflowre.app · 2026-05-29