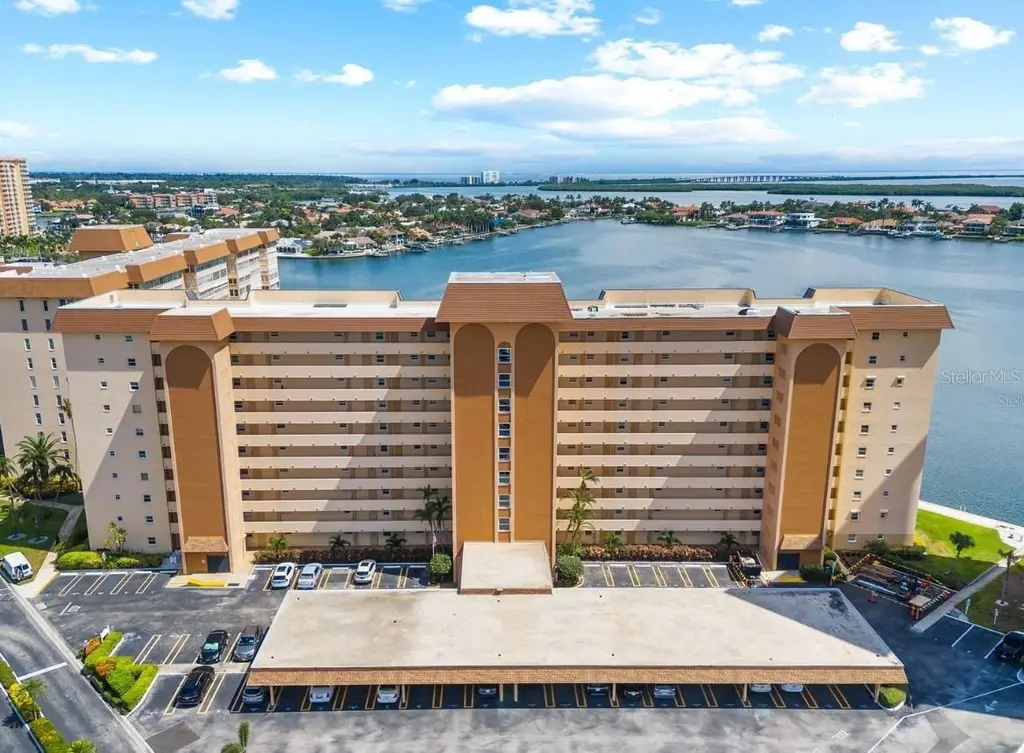
5130 Brittany Dr S #604
St. Petersburg, FL 33715
$205,000C-
1 bd · 1.5 ba ·
1,060 sqft ·
Built 1969
· Condo
· Active
· 38 DOM
Cashflow @ list (25.0% down · 7.5%)
Estimated rent
$2,779/mo
Mortgage (P&I)
−$1,075
Tax + insurance
−$607
HOA
−$852
Vac / Maint / Mgmt
−$583
Net cashflow
$-339/mo
Annual
$-4,062/yr
Cap rate
6.81%
Cash-on-cash
1.84%
DSCR
1.08
1% rule
1.36%
Cash to close
$57,400
Investor read
- This is a 1-bed/1.5-bath condo listed at $205k.
- At list price, monthly cash flow is $-339 ($-4k/yr) — negative.
- To cash-flow at today's rent, offer at most $145k (29.2% below list).
- Meets the 1% rule at list price ($3k rent vs $205k).
- It's been on market 38 days — a 3% lower offer ($199k) is reasonable based on typical stale-listing flexibility.
- Recommended offer: $145k (29.2% below list) — sets the bar for cash-flow.
- In year one you build about $1k of equity ($1k loan paydown + $-318 appreciation (-0.1% local appreciation)).
- Location reads: area grade C — affects rentability + tenant quality, not the cash-flow math above.
- Pinellas (suburban): math 51% / reading 51% proficiency, ranked #31 of 73 in FL (top 42%) — acceptable for families but not a draw, mixed tenant base, ~2y average lease.
- Watch-outs: flood insurance adds $427/mo; HOA is 31% of rent.
- Market conditions: 282 active listings in the ZIP; 40 comparable units currently listed for rent nearby; rentals at typical pace (median 25d on market — plan ~3-4 weeks tenant-placement turnaround); solid renter incomes; 2,676 units permitted in Pinellas County in 2024 (1,422 in 5+ unit buildings).
- Pinellas County population projected at +14% by 2050 — modest demand growth; plan on rents tracking national, not racing it.
- 4 sale attempts since 16y ago with the ask held roughly flat each time — persistent listings suggest the price (not the market) is what's stuck; bring a comps-based counter.
- Current owner paid $103k; list at $205k implies a 99% gain — meaningful room to come down on a strong offer.
- Climate carrying-cost: in FEMA flood zone AE (mandatory federal flood insurance); severe wind risk, 99% chance of damaging wind over 30y; extreme-heat days projected 6→21/yr by 2055 (HVAC capex compounding) — expect insurance premiums to compound above CPI over the hold.
- Cap rate 6.8% vs local median 2.6% in St. Petersburg — top-decile yield for the area; either an underpriced asset or a hidden risk that comps aren't pricing in. Stress-test before assuming the spread holds.
- This rent runs 32% of the median local income ($103k/yr) — at the standard rent-burdened threshold; future hikes will face affordability resistance.
Questions for listing agent
- What do current leases actually rent for vs. the listed asking? Can we see a recent rent roll and the last 12 months of T-12 income?
- It's been on market 38 days. Have you received any prior offers? Is the seller open to a 29% concession, seller financing, or rate buy-down credit?
- Built in 1969 — when were the roof, HVAC, electrical panel, plumbing, and water heater last replaced?
- What's the actual annual flood-insurance premium (NFIP or private), and is the property in a SFHA with mandatory coverage?
- What does the HOA fee cover, when was the last increase, and are there any pending special assessments or reserve-fund shortfalls?
- Any open or pending special assessments — roof, HVAC, plumbing, elevator, façade? What's the per-unit balance and payoff schedule, and is the seller paying it off at close or rolling it to the buyer?
- Is there a deadline driving the sale (1031 exchange, divorce, estate, relocation)? That informs how much negotiation room exists.
- What's the average days-on-market for RENTAL listings here right now (not sales)? A rising rental-DOM trend means longer vacancies and softer asking-rent achievability than the comps imply.
CashFlowRE · CFR-VX9CXM4K52W7BP
· Data 2 days ago
cashflowre.app · 2026-05-29