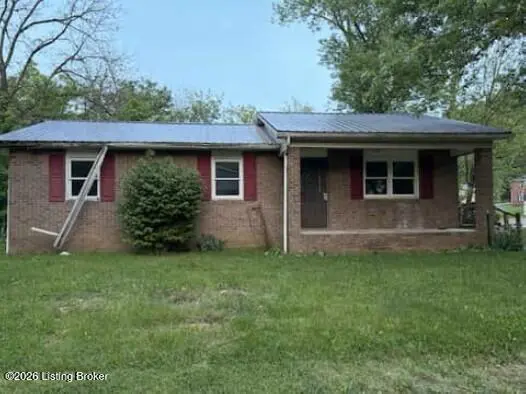
208 Victoria Way
Grayson, KY 41143
$119,000C-
3 bd · 1.0 ba ·
912 sqft ·
Built 1992
· SingleFamily
· Active
· 35 DOM
Cashflow @ list (25.0% down · 7.5%)
Estimated rent
$972/mo
Mortgage (P&I)
−$624
Tax + insurance
−$173
HOA
−$0
Vac / Maint / Mgmt
−$204
Net cashflow
$-28/mo
Annual
$-341/yr
Cap rate
6.68%
Cash-on-cash
1.37%
DSCR
1.06
1% rule
0.82%
Cash to close
$33,320
Investor read
- This is a 3-bed/1.0-bath single-family listed at $119k.
- At list price, monthly cash flow is $-28 ($-341/yr) — negative.
- To cash-flow at today's rent, offer at most $114k (4.2% below list).
- To meet the 1% rule (rent ≥ 1% of price), the offer needs to be $97k (18.3% below list).
- It's been on market 35 days — a 3% lower offer ($115k) is reasonable based on typical stale-listing flexibility.
- Recommended offer: $97k (18.3% below list) — sets the bar for 1% rule.
- In year one you build about $13k of equity ($823 loan paydown + $12k appreciation (10.0% local appreciation)).
- Location reads 70/100 on livability (#161 in KY) — a middle-class / working-renter tenant base. Strengths: cost of living A+, health & safety A+, housing B; Watch: amenities D+, commute F, employment F.
- Carter County (rural): math 27% / reading 43% proficiency, ranked #70 of 165 in KY (top 42%) — families likely to look elsewhere, expect single-tenant / working-renter base with shorter leases.
- Watch-outs: flood insurance adds $66/mo.
- Market conditions: 62 active listings in the ZIP; 1 units permitted in Carter County in 2024 (0 in 5+ unit buildings).
- Carter County population projected at -21% by 2050 — secular population decline; favor cash flow + early exit over multi-decade hold.
- Current owner paid $77k; list at $119k implies a 55% gain — meaningful room to come down on a strong offer.
- At projected returns (10.0% appreciation + 3.0% rent growth), your $33k cash investment doubles in ~3 years — after that, you're playing with house money.
- By year 3, paydown + projected appreciation supports a ~$32k cash-out refi (75% LTV) — recoverable capital for the next deal without selling this one.
- Climate carrying-cost: severe flood risk; major wildfire risk — expect insurance premiums to compound above CPI over the hold.
- Cap rate 6.7% vs local median 4.6% in Grayson — top-decile yield for the area; either an underpriced asset or a hidden risk that comps aren't pricing in. Stress-test before assuming the spread holds.
Questions for listing agent
- What do current leases actually rent for vs. the listed asking? Can we see a recent rent roll and the last 12 months of T-12 income?
- It's been on market 35 days. Have you received any prior offers? Is the seller open to a 18% concession, seller financing, or rate buy-down credit?
- What's the actual annual flood-insurance premium (NFIP or private), and is the property in a SFHA with mandatory coverage?
- Is there a deadline driving the sale (1031 exchange, divorce, estate, relocation)? That informs how much negotiation room exists.
- What's the average days-on-market for RENTAL listings here right now (not sales)? A rising rental-DOM trend means longer vacancies and softer asking-rent achievability than the comps imply.
- What's the recent tenant-quality profile in this submarket — average credit score on applications, eviction rate, late-payment / NSF rate, and stable-employment percentage? A property-management company in the area should have these aggregated.
- How much new for-sale + rental construction is in the pipeline within 1–3 miles? Heavy new supply typically softens prices + rents 12–24 months out; constrained supply supports both.
CashFlowRE · CFR-VXRH5M7K6QMBB2
· Data 2 days ago
cashflowre.app · 2026-05-29