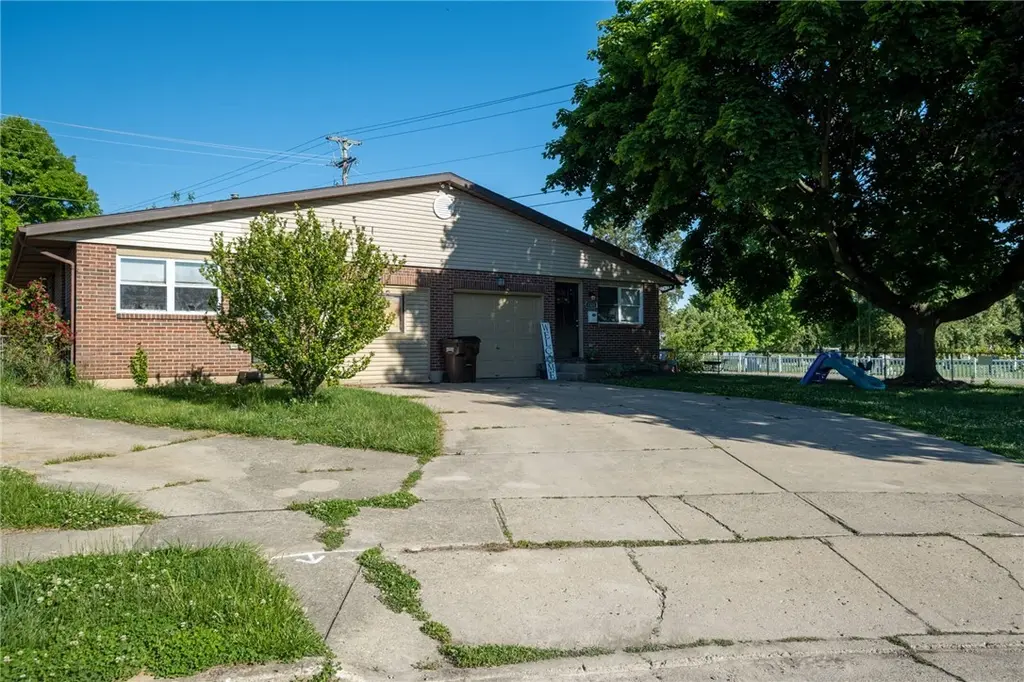
1326-1328 Seneca Dr
Xenia, OH 45385
$275,000C
4 bd · 2.0 ba ·
2,137 sqft ·
Built 1980
· MultiFamily
· Pending
· 1 DOM
Cashflow @ list (25.0% down · 7.5%)
Estimated rent
$3,010/mo
Mortgage (P&I)
−$1,442
Tax + insurance
−$399
HOA
−$0
Vac / Maint / Mgmt
−$632
Net cashflow
$537/mo
Annual
$6,444/yr
Cap rate
8.64%
Cash-on-cash
8.37%
DSCR
1.37
1% rule
1.09%
Cash to close
$77,000
Investor read
- This is a 2 × 2-bed/1.5-bath units multifamily listed at $275k.
- At list price, monthly cash flow is $537 ($6k/yr) — positive. Per door: $269/mo.
- The deal already cash-flows at list — no discount required.
- Meets the 1% rule at list price ($3k rent vs $275k).
- Only 1 days on market — expect competitive offers; lowballing is unlikely to land.
- Local home prices are declining (-3.0%/yr); year-one equity from $2k of loan paydown is wiped out by about $8k of value loss. Plan a longer hold.
- Location reads 75/100 on livability (#244 in OH, #3,892 nationally) — a middle-class / working-renter tenant base. Strengths: cost of living A+, housing A+, health & safety B+; Watch: amenities D+, commute F, employment F.
- Xenia Community City (suburban): math 42% / reading 53% proficiency, ranked #478 of 656 in OH (top 73%) — families likely to look elsewhere, expect single-tenant / working-renter base with shorter leases.
- Zoned schools: Arrowood Elementary (math 55% / reading 50%, grade C-, #846 of 1,584 statewide, top 54%, 419 students, 0% FRL); Warner Middle School (math 35% / reading 45%, grade F, #511 of 654 statewide, top 79%, 848 students, 0% FRL); Xenia High School (math 25% / reading 63%, grade F, #489 of 781 statewide, top 63%, 985 students, 48% FRL) — zoned schools average 16% FRL vs 50% district-wide (34 pts lower); this property's tenant base skews higher-income than the district average.
- Market conditions: Rents rising fast (+5.5%/yr); 240 active listings in the ZIP; 1 comparable units currently listed for rent nearby; solid renter incomes; 797 units permitted in Greene County in 2024 (148 in 5+ unit buildings).
- Current owner paid $160k; list at $275k implies a 72% gain — meaningful room to come down on a strong offer.
- At projected returns (-3.0% appreciation + 5.5% rent growth), your $77k cash investment doubles in ~10 years — after that, you're playing with house money.
- Cap rate 8.6% vs local median 3.7% in Xenia — top-decile yield for the area; either an underpriced asset or a hidden risk that comps aren't pricing in. Stress-test before assuming the spread holds.
- At $3,010/mo this rent would consume 47% of the median local household income ($77k/yr) (locally 906% of renters already pay >50% of income on rent) — very limited rent-growth headroom before tenants either downsize or default.
Questions for listing agent
- Can we see the unit-by-unit rent roll, current vacancy, and any below-market leases? What's the average tenancy length?
- What capital expenditures (roof, boiler, parking lot, exteriors) have been made in the last 5 years, and what's planned in the next 2?
- Is there a deadline driving the sale (1031 exchange, divorce, estate, relocation)? That informs how much negotiation room exists.
- What's the average days-on-market for RENTAL listings here right now (not sales)? A rising rental-DOM trend means longer vacancies and softer asking-rent achievability than the comps imply.
- What's the recent tenant-quality profile in this submarket — average credit score on applications, eviction rate, late-payment / NSF rate, and stable-employment percentage? A property-management company in the area should have these aggregated.
- How much new apartment / multifamily construction is in the pipeline within 1–3 miles? Heavy new supply (>2% of stock underway) typically softens rents 12–24 months out; light construction supports rent growth.
CashFlowRE · CFR-VZ90KG9445XY8H
· Data 4 weeks ago
cashflowre.app · 2026-05-29