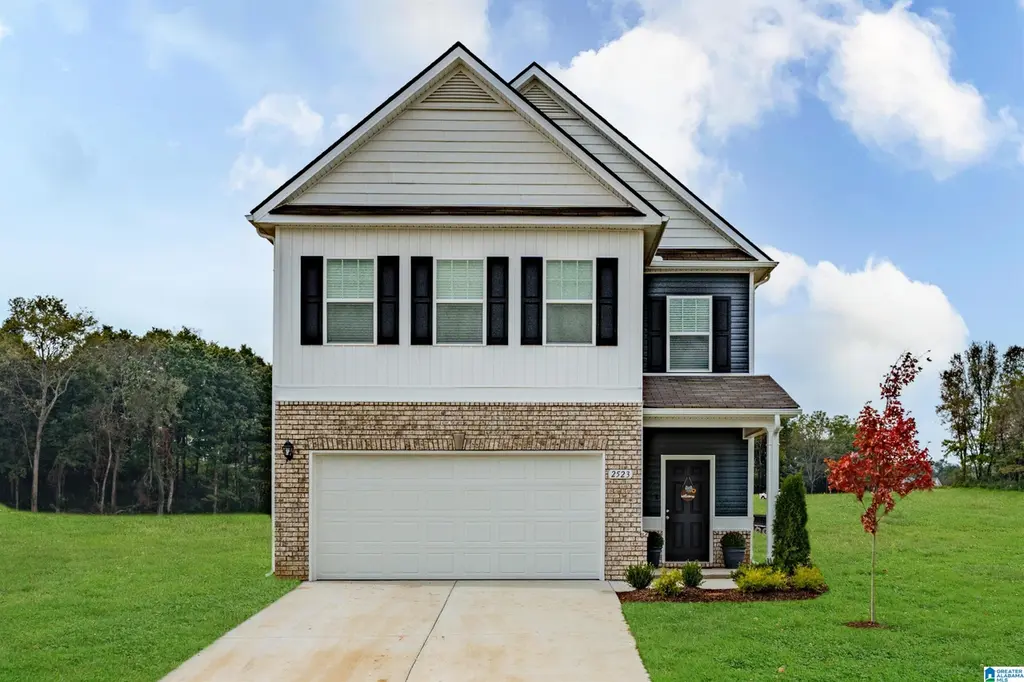
The Greenbrier Brunswick Ave
Kimberly, AL 35091
$283,900D+
3 bd · 2.5 ba ·
2,237 sqft ·
Built 2026
· SingleFamily
· Active
· 339 DOM
Cashflow @ list (25.0% down · 7.5%)
Estimated rent
$2,200/mo
Mortgage (P&I)
−$1,489
Tax + insurance
−$540
HOA
−$0
Vac / Maint / Mgmt
−$462
Net cashflow
$-290/mo
Annual
$-3,485/yr
Cap rate
5.35%
Cash-on-cash
-3.38%
DSCR
0.85
1% rule
0.77%
Cash to close
$79,492
Investor read
- This is a 3-bed/2.5-bath single-family listed at $284k.
- At list price, monthly cash flow is $-290 ($-3k/yr) — negative.
- To cash-flow at today's rent, offer at most $242k (14.8% below list).
- To meet the 1% rule (rent ≥ 1% of price), the offer needs to be $220k (22.5% below list).
- It's been on market 339 days — a 12% lower offer ($250k) is reasonable based on typical stale-listing flexibility.
- Recommended offer: $220k (22.5% below list) — sets the bar for 1% rule.
- In year one you build about $30k of equity ($2k loan paydown + $28k appreciation (10.0% local appreciation)).
- Location reads 66/100 on livability (#99 in AL) — a middle-class / working-renter tenant base. Strengths: crime A+, employment A+, housing A+; Watch: amenities F, commute F, health & safety F.
- Jefferson County (suburban): math 9% / reading 32% proficiency, ranked #104 of 129 in AL (top 81%) — low school quality limits family demand, transient renter base, plan for 1-2y turnover.
- Watch-outs: flood insurance adds $66/mo.
- Market conditions: 129 active listings in the ZIP; 1 comparable units currently listed for rent nearby; 2,114 units permitted in Jefferson County in 2024 (556 in 5+ unit buildings).
- Jefferson County population projected to shrink 4% by 2050 — rents likely to lag national; underwrite the cash flow, not the appreciation.
- By year 2, paydown + projected appreciation supports a ~$49k cash-out refi (75% LTV) — recoverable capital for the next deal without selling this one.
- Climate carrying-cost: severe flood risk; major wind risk, 27% chance of damaging wind over 30y; moderate wildfire risk; extreme-heat days projected 7→18/yr by 2055 (HVAC capex compounding) — expect insurance premiums to compound above CPI over the hold.
- Cap rate 5.3% vs local median 4.2% in Kimberly — meaningfully above typical; check what's discounted (condition, days-on-market, listing class) to confirm the premium yield is real.
Questions for listing agent
- What do current leases actually rent for vs. the listed asking? Can we see a recent rent roll and the last 12 months of T-12 income?
- It's been on market 339 days. Have you received any prior offers? Is the seller open to a 23% concession, seller financing, or rate buy-down credit?
- What's the actual annual flood-insurance premium (NFIP or private), and is the property in a SFHA with mandatory coverage?
- Why hasn't it sold? Are there any deal-killer items the seller is aware of (foundation, flood, title, zoning, code violations)?
- Is there a deadline driving the sale (1031 exchange, divorce, estate, relocation)? That informs how much negotiation room exists.
- The area grade is low — what's the realistic commute time and amenity access for the typical tenant pool here? Any planned neighborhood developments (good or bad) we should know about?
- What's the average days-on-market for RENTAL listings here right now (not sales)? A rising rental-DOM trend means longer vacancies and softer asking-rent achievability than the comps imply.
- What's the recent tenant-quality profile in this submarket — average credit score on applications, eviction rate, late-payment / NSF rate, and stable-employment percentage? A property-management company in the area should have these aggregated.
CashFlowRE · CFR-VZYV0W203RAG3G
· Data 2 days ago
cashflowre.app · 2026-05-29