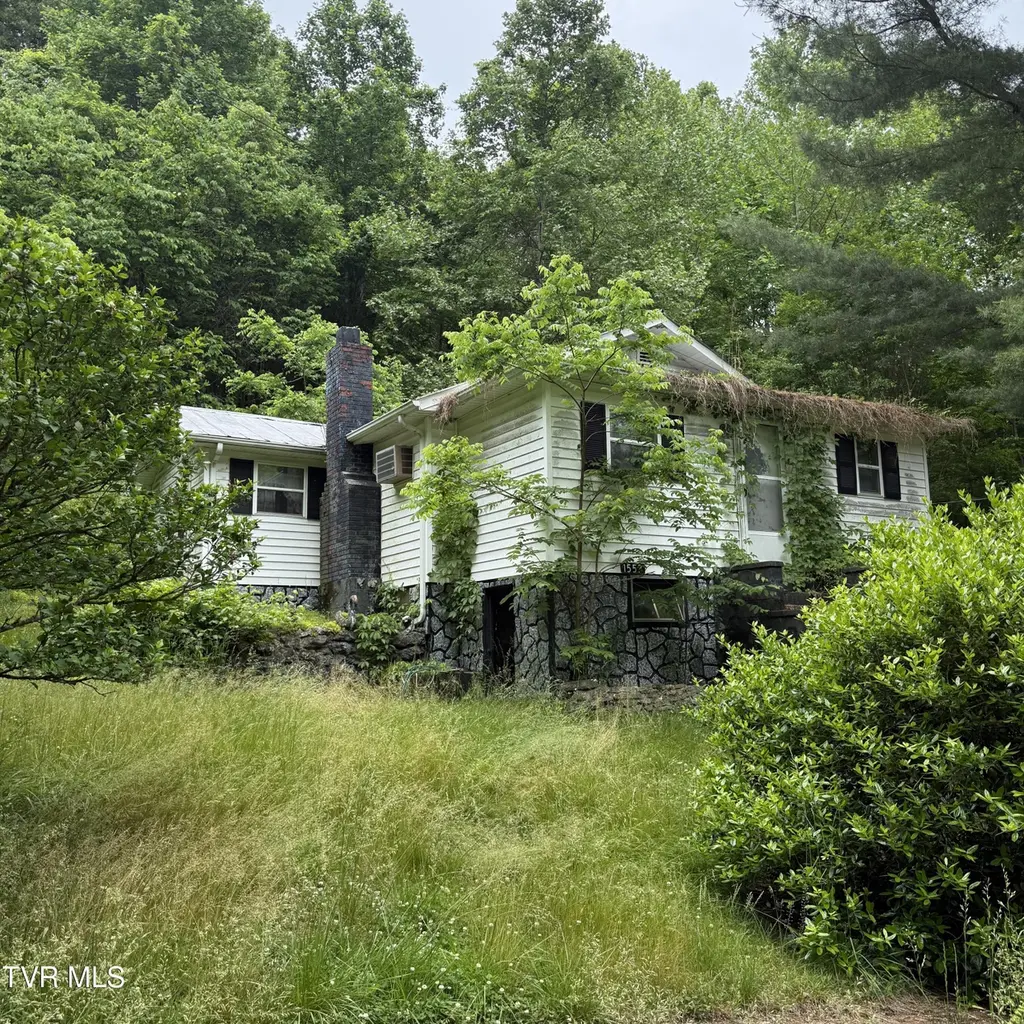
1552 Sugar Pine Ln
Mount Carmel, TN 24251
$17,500C-
2 bd · 1.0 ba ·
728 sqft ·
Built 1950
· SingleFamily
· Pending
· 4 DOM
Cashflow @ list (25.0% down · 7.5%)
Estimated rent
$1,151/mo
Mortgage (P&I)
−$92
Tax + insurance
−$78
HOA
−$0
Vac / Maint / Mgmt
−$242
Net cashflow
$739/mo
Annual
$8,873/yr
Cap rate
60.80%
Cash-on-cash
194.68%
DSCR
9.66
1% rule
6.58%
Cash to close
$4,900
Investor read
- This is a 2-bed/1.0-bath single-family listed at $18k.
- At list price, monthly cash flow is $739 ($9k/yr) — positive.
- The deal already cash-flows at list — no discount required.
- Meets the 1% rule at list price ($1k rent vs $18k).
- Only 4 days on market — expect competitive offers; lowballing is unlikely to land.
- In year one you build about $160 of equity ($121 loan paydown + $39 appreciation (0.2% local appreciation)).
- Location reads 65/100 on livability (#140 in TN) — a middle-class / working-renter tenant base. Strengths: cost of living A+, housing A+; Watch: crime C-, employment D+, amenities F.
- Scott County Public School District (rural): math 66% / reading 73% proficiency, ranked #33 of 131 in VA (top 25%) — acceptable for families but not a draw, mixed tenant base, ~2y average lease.
- Zoned schools: Shoemaker Elementary (math 64% / reading 72%, grade B+, #366 of 1,108 statewide, top 33%, 450 students, 81% FRL); Gate City Middle (math 74% / reading 71%, grade A, #61 of 342 statewide, top 18%, 333 students, 78% FRL); Gate City High (math 77% / reading 82%, grade A-, #63 of 319 statewide, top 22%, 619 students, 77% FRL) — zoned schools average 79% FRL vs 48% district-wide (31 pts higher); higher-poverty schools than district average — tighter screening recommended.
- Watch-outs: flood insurance adds $56/mo; built in 1950 — expect roof / HVAC / electrical / plumbing capex.
- Market conditions: 22 units permitted in Scott County in 2024 (0 in 5+ unit buildings).
- Scott County population projected at -24% by 2050 — secular population decline; favor cash flow + early exit over multi-decade hold.
- At projected returns (0.2% appreciation + 3.0% rent growth), your $5k cash investment doubles in ~1 year — after that, you're playing with house money.
- Climate carrying-cost: severe flood risk; major wildfire risk — expect insurance premiums to compound above CPI over the hold.
- Cap rate 60.8% vs local median 4.2% in Mount Carmel — top-decile yield for the area; either an underpriced asset or a hidden risk that comps aren't pricing in. Stress-test before assuming the spread holds.
Questions for listing agent
- Built in 1950 — when were the roof, HVAC, electrical panel, plumbing, and water heater last replaced?
- What's the actual annual flood-insurance premium (NFIP or private), and is the property in a SFHA with mandatory coverage?
- Is there a deadline driving the sale (1031 exchange, divorce, estate, relocation)? That informs how much negotiation room exists.
- Schools are D-rated, which usually means shorter tenancies and higher turnover. Who's the typical renter profile here, and what's been the actual vacancy rate?
- What's the average days-on-market for RENTAL listings here right now (not sales)? A rising rental-DOM trend means longer vacancies and softer asking-rent achievability than the comps imply.
- What's the recent tenant-quality profile in this submarket — average credit score on applications, eviction rate, late-payment / NSF rate, and stable-employment percentage? A property-management company in the area should have these aggregated.
- How much new for-sale + rental construction is in the pipeline within 1–3 miles? Heavy new supply typically softens prices + rents 12–24 months out; constrained supply supports both.
CashFlowRE · CFR-W058WE2RMS8709
· Data 3 weeks ago
cashflowre.app · 2026-05-29