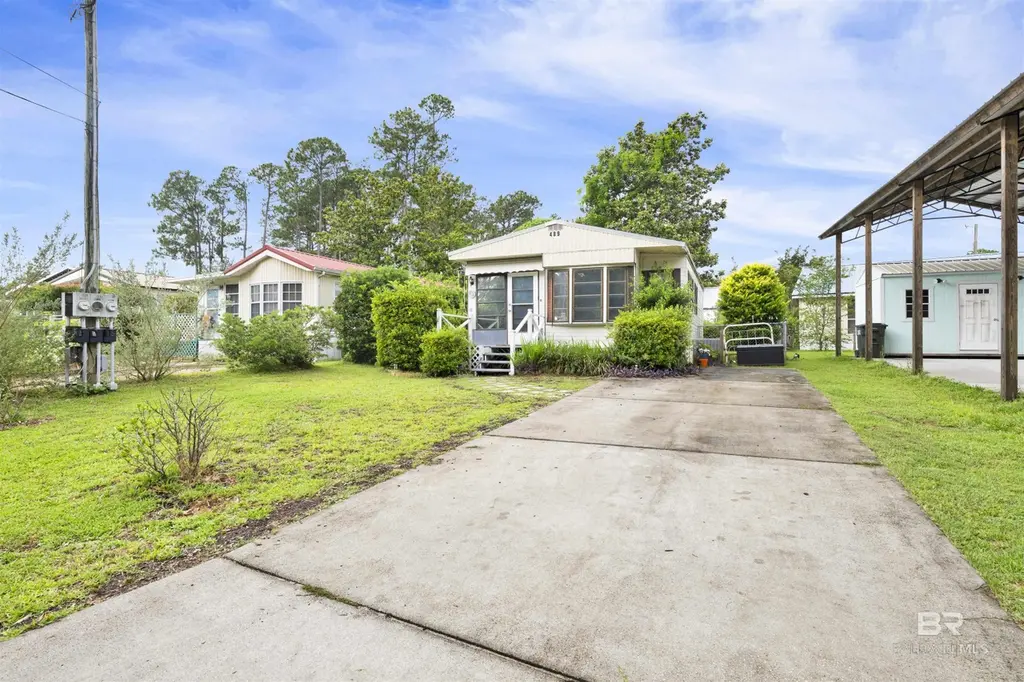
489 Elberta Loop
Lillian, AL 36549
$120,000C
1 bd · 2.0 ba ·
288 sqft ·
Built 1983
· Manufactured
· Active
· 29 DOM
Cashflow @ list (25.0% down · 7.5%)
Estimated rent
$1,355/mo
Mortgage (P&I)
−$629
Tax + insurance
−$200
HOA
−$74
Vac / Maint / Mgmt
−$285
Net cashflow
$167/mo
Annual
$2,010/yr
Cap rate
7.97%
Cash-on-cash
5.98%
DSCR
1.27
1% rule
1.13%
Cash to close
$33,600
Investor read
- This is a 1-bed/2.0-bath manufactured listed at $120k.
- At list price, monthly cash flow is $167 ($2k/yr) — positive.
- The deal already cash-flows at list — no discount required.
- Meets the 1% rule at list price ($1k rent vs $120k).
- It's been on market 29 days — a 2% lower offer ($118k) is reasonable based on typical stale-listing flexibility.
- Recommended offer: $118k (1.5% below list) — sets the bar for market timing.
- Local home prices are declining (-3.0%/yr); year-one equity from $830 of loan paydown is wiped out by about $4k of value loss. Plan a longer hold.
- Location reads 66/100 on livability (#97 in AL) — a middle-class / working-renter tenant base. Strengths: crime A+, housing A+, cost of living A-; Watch: amenities F, commute F, health & safety F.
- Baldwin County (rural): math 33% / reading 57% proficiency, ranked #18 of 129 in AL (top 14%) — families likely to look elsewhere, expect single-tenant / working-renter base with shorter leases.
- Zoned schools: Elberta Elementary School (math 47% / reading 65%, grade C+, #83 of 627 statewide, top 13%, 884 students, 58% FRL); Elberta Middle School (math 21% / reading 67%, grade D, #42 of 257 statewide, top 17%, 267 students, 63% FRL); Elberta High School (math 32% / reading 37%, grade F, #47 of 305 statewide, top 17%, 784 students, 60% FRL) — zoned schools average 60% FRL vs 38% district-wide (22 pts higher); higher-poverty schools than district average — tighter screening recommended.
- Market conditions: 146 active listings in the ZIP; 3,883 units permitted in Baldwin County in 2024 (481 in 5+ unit buildings).
- Baldwin County population projected at +42% by 2050 — long-run rental-demand tailwind backs the buy-and-hold thesis.
- 5 sale attempts since 14y ago with the ask held roughly flat each time — persistent listings suggest the price (not the market) is what's stuck; bring a comps-based counter.
- Climate carrying-cost: severe wind risk, 99% chance of damaging wind over 30y; extreme-heat days projected 7→23/yr by 2055 (HVAC capex compounding) — expect insurance premiums to compound above CPI over the hold.
- Cap rate 8.0% vs local median 4.1% in Lillian — top-decile yield for the area; either an underpriced asset or a hidden risk that comps aren't pricing in. Stress-test before assuming the spread holds.
Questions for listing agent
- What does the HOA fee cover, when was the last increase, and are there any pending special assessments or reserve-fund shortfalls?
- Is there a deadline driving the sale (1031 exchange, divorce, estate, relocation)? That informs how much negotiation room exists.
- What's the average days-on-market for RENTAL listings here right now (not sales)? A rising rental-DOM trend means longer vacancies and softer asking-rent achievability than the comps imply.
- What's the recent tenant-quality profile in this submarket — average credit score on applications, eviction rate, late-payment / NSF rate, and stable-employment percentage? A property-management company in the area should have these aggregated.
- How much new for-sale + rental construction is in the pipeline within 1–3 miles? Heavy new supply typically softens prices + rents 12–24 months out; constrained supply supports both.
CashFlowRE · CFR-W12SFZ801RCBPR
· Data 23 h ago
cashflowre.app · 2026-05-29