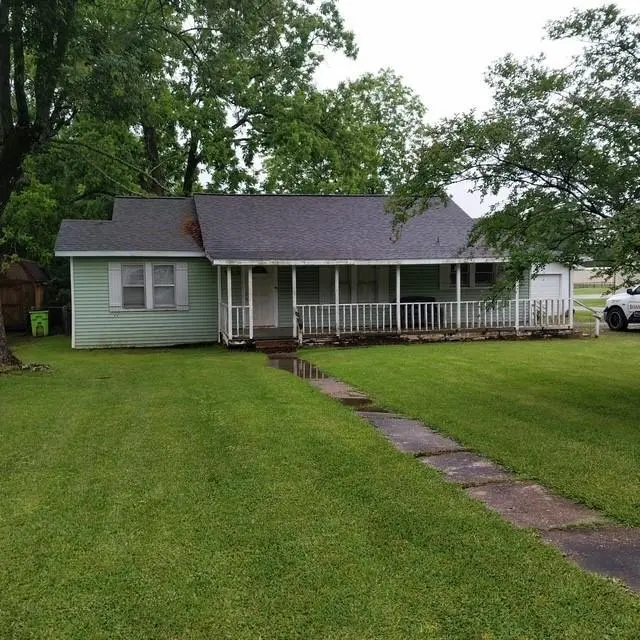
505 Simpson St
Benton, LA 71006
$165,000C-
2 bd · 1.0 ba ·
1,246 sqft ·
Built 1947
· SingleFamily
· Active
· 55 DOM
Cashflow @ list (25.0% down · 7.5%)
Estimated rent
$1,506/mo
Mortgage (P&I)
−$865
Tax + insurance
−$128
HOA
−$0
Vac / Maint / Mgmt
−$316
Net cashflow
$196/mo
Annual
$2,354/yr
Cap rate
7.72%
Cash-on-cash
5.09%
DSCR
1.23
1% rule
0.91%
Cash to close
$46,200
Investor read
- This is a 2-bed/1.0-bath single-family listed at $165k.
- At list price, monthly cash flow is $196 ($2k/yr) — positive.
- The deal already cash-flows at list — no discount required.
- To meet the 1% rule (rent ≥ 1% of price), the offer needs to be $151k (8.8% below list).
- It's been on market 55 days — a 3% lower offer ($160k) is reasonable based on typical stale-listing flexibility.
- Recommended offer: $151k (8.8% below list) — sets the bar for 1% rule.
- Local home prices are declining (-3.0%/yr); year-one equity from $1k of loan paydown is wiped out by about $5k of value loss. Plan a longer hold.
- Location reads 72/100 on livability (#41 in LA) — a middle-class / working-renter tenant base. Strengths: cost of living A+, housing A+, crime A; Watch: amenities F, commute F, health & safety F.
- Bossier Parish (urban): math 40% / reading 47% proficiency, ranked #17 of 98 in LA (top 17%) — families likely to look elsewhere, expect single-tenant / working-renter base with shorter leases.
- Zoned schools: Bossier Elementary School (math 8% / reading 17%, grade F, #550 of 646 statewide, top 88%, 222 students, 93% FRL) — zoned schools average 93% FRL vs 41% district-wide (52 pts higher); higher-poverty schools than district average — tighter screening recommended.
- Zoned-school proficiency averages 12% at this address vs 44% district-wide (-31 pts) — the specific schools serving this property underperform the Bossier Parish average; the district grade overstates school quality for this exact location.
- Watch-outs: built in 1947 — expect roof / HVAC / electrical / plumbing capex.
- Market conditions: 201 active listings in the ZIP; 716 units permitted in Bossier Parish in 2024 (0 in 5+ unit buildings).
- Bossier County population projected at +28% by 2050 — long-run rental-demand tailwind backs the buy-and-hold thesis.
- 2 sale attempts since 4y ago with the ask held roughly flat each time — persistent listings suggest the price (not the market) is what's stuck; bring a comps-based counter.
- Climate carrying-cost: major wind risk, 61% chance of damaging wind over 30y; extreme-heat days projected 7→22/yr by 2055 (HVAC capex compounding) — expect insurance premiums to compound above CPI over the hold.
- Cap rate 7.7% vs local median 3.4% in Benton — top-decile yield for the area; either an underpriced asset or a hidden risk that comps aren't pricing in. Stress-test before assuming the spread holds.
Questions for listing agent
- It's been on market 55 days. Have you received any prior offers? Is the seller open to a 9% concession, seller financing, or rate buy-down credit?
- Built in 1947 — when were the roof, HVAC, electrical panel, plumbing, and water heater last replaced?
- Is there a deadline driving the sale (1031 exchange, divorce, estate, relocation)? That informs how much negotiation room exists.
- Schools are A-rated — typically a magnet for longer-tenancy family renters. What's the average tenant stay here, and is there a school-zone premium baked into asking?
- What's the average days-on-market for RENTAL listings here right now (not sales)? A rising rental-DOM trend means longer vacancies and softer asking-rent achievability than the comps imply.
- What's the recent tenant-quality profile in this submarket — average credit score on applications, eviction rate, late-payment / NSF rate, and stable-employment percentage? A property-management company in the area should have these aggregated.
- How much new for-sale + rental construction is in the pipeline within 1–3 miles? Heavy new supply typically softens prices + rents 12–24 months out; constrained supply supports both.
CashFlowRE · CFR-W4KPZJ788JMT9B
· Data 7 h ago
cashflowre.app · 2026-05-29