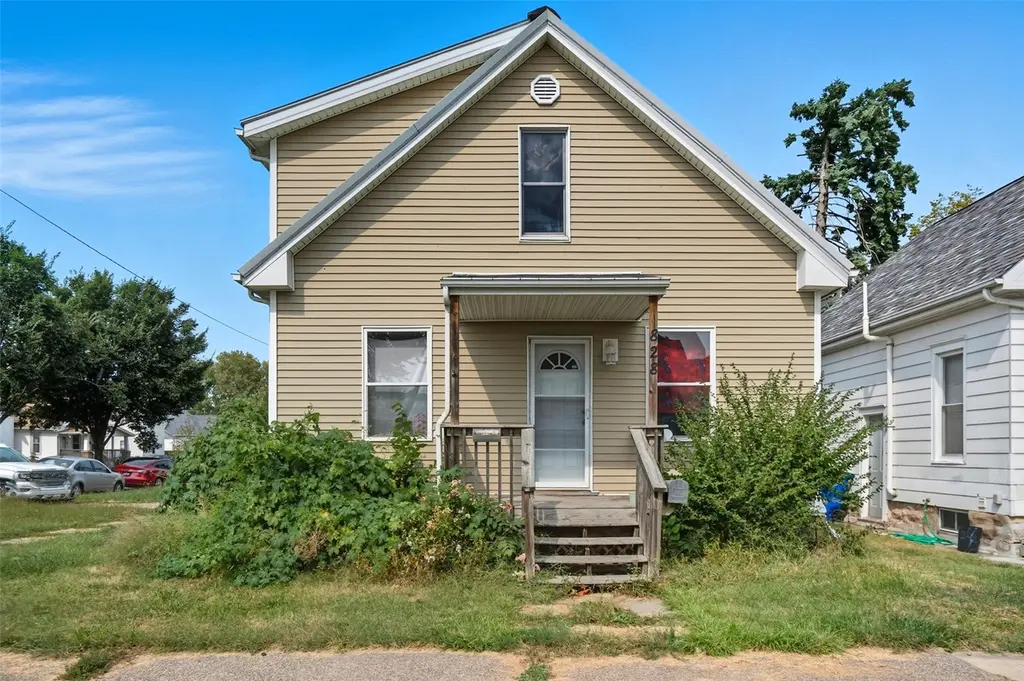
828 8th Ave SW
Cedar Rapids, IA 52404
$119,900B-
2 bd · 1.5 ba ·
1,061 sqft ·
Built 1902
· SingleFamily
· Pending
· 7 DOM
Cashflow @ list (25.0% down · 7.5%)
Estimated rent
$1,349/mo
Mortgage (P&I)
−$629
Tax + insurance
−$181
HOA
−$0
Vac / Maint / Mgmt
−$283
Net cashflow
$257/mo
Annual
$3,080/yr
Cap rate
8.86%
Cash-on-cash
9.18%
DSCR
1.41
1% rule
1.13%
Cash to close
$33,572
Investor read
- This is a 2-bed/1.5-bath single-family listed at $120k.
- At list price, monthly cash flow is $257 ($3k/yr) — positive.
- The deal already cash-flows at list — no discount required.
- Meets the 1% rule at list price ($1k rent vs $120k).
- Only 7 days on market — expect competitive offers; lowballing is unlikely to land.
- Local home prices are declining (-3.0%/yr); year-one equity from $829 of loan paydown is wiped out by about $4k of value loss. Plan a longer hold.
- Location reads 78/100 on livability (#134 in IA, #2,474 nationally) — a middle-class / working-renter tenant base. Strengths: cost of living A+, housing A+, health & safety A+; Watch: crime C-, commute F.
- Cedar Rapids Community School District (urban): math 50% / reading 59% proficiency, ranked #265 of 289 in IA (top 92%) — acceptable for families but not a draw, mixed tenant base, ~2y average lease.
- Zoned schools: Cleveland Elementary School (math 37% / reading 47%, grade F, #563 of 616 statewide, top 93%, 293 students, 69% FRL); Roosevelt Creative Corridor Business Academy (math 36% / reading 47%, grade F, #235 of 246 statewide, top 96%, 510 students, 69% FRL); Thomas Jefferson High School (math 41% / reading 62%, grade D+, #307 of 336 statewide, top 91%, 1,543 students, 56% FRL) — zoned schools average 65% FRL vs 43% district-wide (21 pts higher); higher-poverty schools than district average — tighter screening recommended.
- Watch-outs: built in 1902 — expect roof / HVAC / electrical / plumbing capex.
- Market conditions: Rents rising fast (+8.8%/yr); 415 active listings in the ZIP; 3 comparable units currently listed for rent nearby; rentals leasing fast (median 14d on market — plan ~1-2 weeks tenant-placement turnaround); 1,023 units permitted in Linn County in 2024 (456 in 5+ unit buildings).
- Linn County population projected at +16% by 2050 — long-run rental-demand tailwind backs the buy-and-hold thesis.
- 7 sale attempts since 6y ago with the ask held roughly flat each time — persistent listings suggest the price (not the market) is what's stuck; bring a comps-based counter.
- Current owner paid $72k; list at $120k implies a 68% gain — meaningful room to come down on a strong offer.
- At projected returns (-3.0% appreciation + 8.0% rent growth), your $34k cash investment doubles in ~8 years — after that, you're playing with house money.
- Cap rate 8.9% vs local median 3.5% in Cedar Rapids — top-decile yield for the area; either an underpriced asset or a hidden risk that comps aren't pricing in. Stress-test before assuming the spread holds.
Questions for listing agent
- Built in 1902 — when were the roof, HVAC, electrical panel, plumbing, and water heater last replaced?
- Is there a deadline driving the sale (1031 exchange, divorce, estate, relocation)? That informs how much negotiation room exists.
- Schools are B-rated — typically a magnet for longer-tenancy family renters. What's the average tenant stay here, and is there a school-zone premium baked into asking?
- What's the average days-on-market for RENTAL listings here right now (not sales)? A rising rental-DOM trend means longer vacancies and softer asking-rent achievability than the comps imply.
- What's the recent tenant-quality profile in this submarket — average credit score on applications, eviction rate, late-payment / NSF rate, and stable-employment percentage? A property-management company in the area should have these aggregated.
- How much new for-sale + rental construction is in the pipeline within 1–3 miles? Heavy new supply typically softens prices + rents 12–24 months out; constrained supply supports both.
CashFlowRE · CFR-W4SVWF1YMKDFGD
· Data 3 weeks ago
cashflowre.app · 2026-05-29