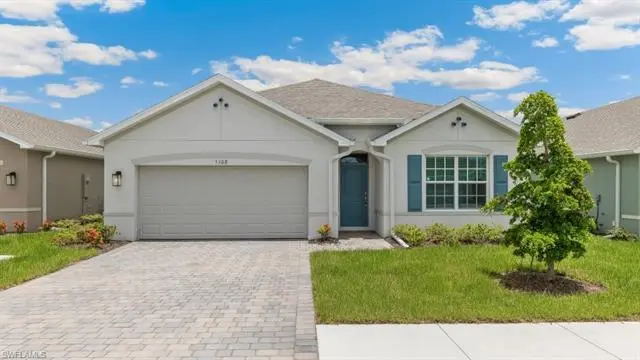
1721 Palmetto Ave
Lehigh Acres, FL 33972
$341,875F
4 bd · 2.0 ba ·
1,828 sqft ·
Built 2026
· Land
· Pending
· 31 DOM
Cashflow @ list (25.0% down · 7.5%)
Estimated rent
$2,244/mo
Mortgage (P&I)
−$1,793
Tax + insurance
−$636
HOA
−$0
Vac / Maint / Mgmt
−$471
Net cashflow
$-656/mo
Annual
$-7,875/yr
Cap rate
4.22%
Cash-on-cash
-7.39%
DSCR
0.67
1% rule
0.66%
Cash to close
$95,725
Investor read
- This is a 4-bed/2.0-bath land listed at $342k.
- At list price, monthly cash flow is $-656 ($-8k/yr) — negative.
- To cash-flow at today's rent, offer at most $247k (27.8% below list).
- To meet the 1% rule (rent ≥ 1% of price), the offer needs to be $224k (34.4% below list).
- It's been on market 31 days — a 3% lower offer ($332k) is reasonable based on typical stale-listing flexibility.
- Recommended offer: $224k (34.4% below list) — sets the bar for 1% rule.
- Local home prices are declining (-3.0%/yr); year-one equity from $2k of loan paydown is wiped out by about $10k of value loss. Plan a longer hold.
- Location reads 59/100 on livability (#826 in FL) — a working-class tenant base; expect higher turnover. Strengths: cost of living A+, housing A+; Watch: crime C-, employment D+, schools D-.
- Lee (suburban): math 47% / reading 50% proficiency, ranked #42 of 73 in FL (top 58%) — families likely to look elsewhere, expect single-tenant / working-renter base with shorter leases.
- Watch-outs: flood insurance adds $66/mo.
- Market conditions: Rents rising fast (+5.3%/yr); 1611 active listings in the ZIP; 16 comparable units currently listed for rent nearby; rentals at typical pace (median 24d on market — plan ~3-4 weeks tenant-placement turnaround); 15,411 units permitted in Lee County in 2024 (4,686 in 5+ unit buildings).
- Lee County population projected at +44% by 2050 — long-run rental-demand tailwind backs the buy-and-hold thesis.
- 2 sale attempts since 21y ago; this cycle's ask has dropped $25k (7%) from the opening price — seller is motivated, your offer sets the floor, not the list.
- Climate carrying-cost: severe flood risk; severe wind risk, 99% chance of damaging wind over 30y; extreme-heat days projected 7→27/yr by 2055 (HVAC capex compounding) — expect insurance premiums to compound above CPI over the hold.
- This rent runs 36% of the median local income ($74k/yr) — at the standard rent-burdened threshold; future hikes will face affordability resistance.
Questions for listing agent
- What do current leases actually rent for vs. the listed asking? Can we see a recent rent roll and the last 12 months of T-12 income?
- It's been on market 31 days. Have you received any prior offers? Is the seller open to a 34% concession, seller financing, or rate buy-down credit?
- What's the actual annual flood-insurance premium (NFIP or private), and is the property in a SFHA with mandatory coverage?
- Is there a deadline driving the sale (1031 exchange, divorce, estate, relocation)? That informs how much negotiation room exists.
- Schools are D-rated, which usually means shorter tenancies and higher turnover. Who's the typical renter profile here, and what's been the actual vacancy rate?
- The area grade is low — what's the realistic commute time and amenity access for the typical tenant pool here? Any planned neighborhood developments (good or bad) we should know about?
- What's the average days-on-market for RENTAL listings here right now (not sales)? A rising rental-DOM trend means longer vacancies and softer asking-rent achievability than the comps imply.
- What's the recent tenant-quality profile in this submarket — average credit score on applications, eviction rate, late-payment / NSF rate, and stable-employment percentage? A property-management company in the area should have these aggregated.
CashFlowRE · CFR-W4WD2W5PY5W2F0
· Data 1 week ago
cashflowre.app · 2026-05-29