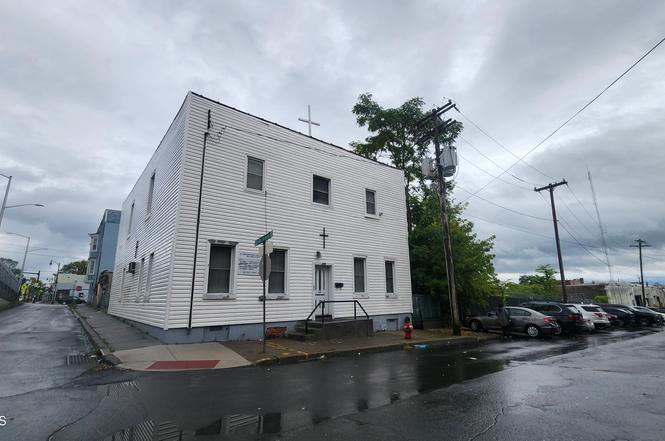
269 Spruce St
Albany, NY 12210
$150,000B
None bd · 3.0 ba ·
4,408 sqft ·
Built 1870
· MultiFamily
· Pending
· 41 DOM
Cashflow @ list (25.0% down · 7.5%)
Estimated rent
$3,838/mo
Mortgage (P&I)
−$787
Tax + insurance
−$250
HOA
−$0
Vac / Maint / Mgmt
−$806
Net cashflow
$1,995/mo
Annual
$23,945/yr
Cap rate
22.26%
Cash-on-cash
57.01%
DSCR
3.54
1% rule
2.56%
Cash to close
$42,000
Investor read
- This is a ?-bed/3.0-bath multifamily listed at $150k.
- At list price, monthly cash flow is $2k ($24k/yr) — positive.
- The deal already cash-flows at list — no discount required.
- Meets the 1% rule at list price ($4k rent vs $150k).
- It's been on market 41 days — a 3% lower offer ($146k) is reasonable based on typical stale-listing flexibility.
- Recommended offer: $146k (3.0% below list) — sets the bar for market timing.
- Local home prices are declining (-3.0%/yr); year-one equity from $1k of loan paydown is wiped out by about $4k of value loss. Plan a longer hold.
- Location reads 79/100 on livability (#129 in NY, #2,083 nationally) — a middle-class / working-renter tenant base. Strengths: amenities A+, commute A+, housing A+; Watch: employment C-, crime F.
- Albany City School District (urban): math 37% / reading 40% proficiency, ranked #543 of 590 in NY (top 92%) — families likely to look elsewhere, expect single-tenant / working-renter base with shorter leases; 66% free/reduced lunch — lower-income household profile, screen leases tightly.
- Zoned schools: Albany High School (math 74% / reading 67%, grade B+, #710 of 1,100 statewide, top 65%, 2,676 students, 69% FRL) — zoned schools at 69% FRL track the district average.
- Zoned-school proficiency averages 70% at this address vs 38% district-wide (+32 pts) — the actual schools serving this property are materially stronger than the Albany City School District average implies; a family-tenant draw the district grade alone would hide.
- Watch-outs: built in 1870 — expect roof / HVAC / electrical / plumbing capex.
- Market conditions: Rents rising fast (+6.9%/yr); 70 active listings in the ZIP; 675 units permitted in Albany County in 2024 (451 in 5+ unit buildings).
- Albany County population projected at +9% by 2050 — modest demand growth; plan on rents tracking national, not racing it.
- At projected returns (-3.0% appreciation + 6.9% rent growth), your $42k cash investment doubles in ~2 years — after that, you're playing with house money.
- Cap rate 22.3% vs local median 5.7% in Albany — top-decile yield for the area; either an underpriced asset or a hidden risk that comps aren't pricing in. Stress-test before assuming the spread holds.
- At $3,838/mo this rent would consume 82% of the median local household income ($56k/yr) (locally 1211% of renters already pay >50% of income on rent) — very limited rent-growth headroom before tenants either downsize or default.
Questions for listing agent
- It's been on market 41 days. Have you received any prior offers? Is the seller open to a 3% concession, seller financing, or rate buy-down credit?
- Built in 1870 — when were the roof, HVAC, electrical panel, plumbing, and water heater last replaced?
- Is there a deadline driving the sale (1031 exchange, divorce, estate, relocation)? That informs how much negotiation room exists.
- Crime grade is F in this area — have there been break-ins, vandalism, or insurance claims at this property in the last 3 years? What carrier currently insures it and at what premium?
- What's the average days-on-market for RENTAL listings here right now (not sales)? A rising rental-DOM trend means longer vacancies and softer asking-rent achievability than the comps imply.
- What's the recent tenant-quality profile in this submarket — average credit score on applications, eviction rate, late-payment / NSF rate, and stable-employment percentage? A property-management company in the area should have these aggregated.
- How much new apartment / multifamily construction is in the pipeline within 1–3 miles? Heavy new supply (>2% of stock underway) typically softens rents 12–24 months out; light construction supports rent growth.
CashFlowRE · CFR-W57YYCEGG8PJS4
· Data 3 weeks ago
cashflowre.app · 2026-05-29