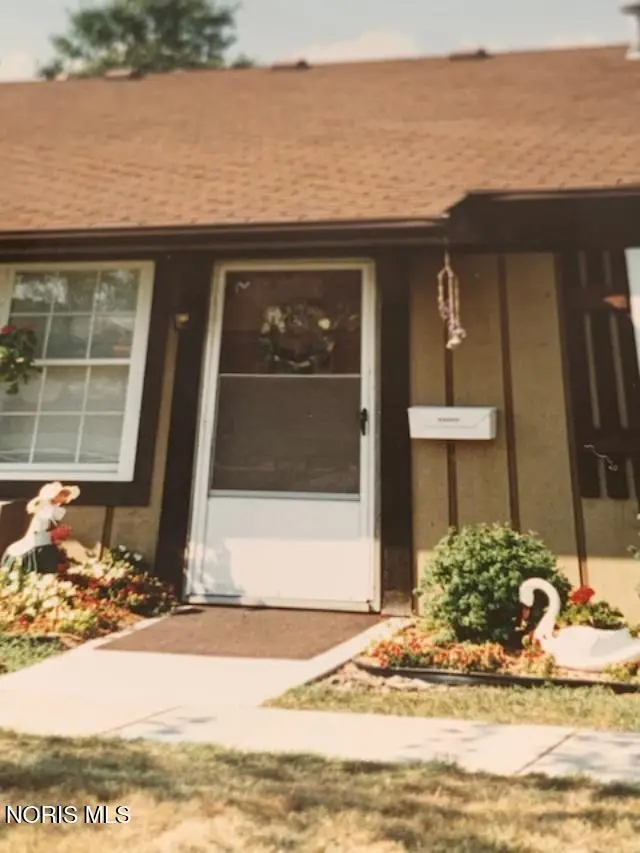
1140 S Mccord Rd Unit E-11
Holland, OH 43528
$55,000B
1 bd · 1.0 ba ·
576 sqft ·
Built 1979
· Condo
· Pending
· 49 DOM
Cashflow @ list (25.0% down · 7.5%)
Estimated rent
$1,075/mo
Mortgage (P&I)
−$288
Tax + insurance
−$77
HOA
−$100
Vac / Maint / Mgmt
−$226
Net cashflow
$384/mo
Annual
$4,611/yr
Cap rate
14.68%
Cash-on-cash
29.94%
DSCR
2.33
1% rule
1.96%
Cash to close
$15,400
Investor read
- This is a 1-bed/1.0-bath condo listed at $55k.
- At list price, monthly cash flow is $384 ($5k/yr) — positive.
- The deal already cash-flows at list — no discount required.
- Meets the 1% rule at list price ($1k rent vs $55k).
- It's been on market 49 days — a 3% lower offer ($53k) is reasonable based on typical stale-listing flexibility.
- Recommended offer: $53k (3.0% below list) — sets the bar for market timing.
- Local home prices are declining (-3.0%/yr); year-one equity from $380 of loan paydown is wiped out by about $2k of value loss. Plan a longer hold.
- Location reads 80/100 on livability (#110 in OH, #1,661 nationally) — a professional / high-income tenant draw. Strengths: cost of living A+, housing A+, health & safety A+; Watch: crime C-, commute F.
- Springfield Local (suburban): math 47% / reading 57% proficiency, ranked #404 of 656 in OH (top 62%) — acceptable for families but not a draw, mixed tenant base, ~2y average lease.
- Zoned schools: Dorr Street Elementary School (math 42% / reading 52%, grade D-, #942 of 1,584 statewide, top 61%, 393 students, 60% FRL); Springfield Middle School (math 44% / reading 53%, grade C-, #435 of 654 statewide, top 67%, 744 students, 81% FRL); Springfield High School (math 40% / reading 60%, grade D+, #384 of 781 statewide, top 49%, 922 students, 48% FRL).
- Market conditions: 79 active listings in the ZIP; 4 comparable units currently listed for rent nearby; rentals at typical pace (median 24d on market — plan ~3-4 weeks tenant-placement turnaround); solid renter incomes; 415 units permitted in Lucas County in 2024 (122 in 5+ unit buildings).
- Lucas County population projected at -16% by 2050 — secular population decline; favor cash flow + early exit over multi-decade hold.
- At projected returns (-3.0% appreciation + 3.0% rent growth), your $15k cash investment doubles in ~5 years — after that, you're playing with house money.
- Cap rate 14.7% vs local median 2.4% in Holland — top-decile yield for the area; either an underpriced asset or a hidden risk that comps aren't pricing in. Stress-test before assuming the spread holds.
- This rent is only 14% of the median local income ($94k/yr) — well below the 30% rent-burden line; pricing power to push rent on renewal without tenant pushback.
Questions for listing agent
- It's been on market 49 days. Have you received any prior offers? Is the seller open to a 3% concession, seller financing, or rate buy-down credit?
- Built in 1979 — when were the roof, HVAC, electrical panel, plumbing, and water heater last replaced?
- What does the HOA fee cover, when was the last increase, and are there any pending special assessments or reserve-fund shortfalls?
- Any open or pending special assessments — roof, HVAC, plumbing, elevator, façade? What's the per-unit balance and payoff schedule, and is the seller paying it off at close or rolling it to the buyer?
- Is there a deadline driving the sale (1031 exchange, divorce, estate, relocation)? That informs how much negotiation room exists.
- Schools are B-rated — typically a magnet for longer-tenancy family renters. What's the average tenant stay here, and is there a school-zone premium baked into asking?
- What's the average days-on-market for RENTAL listings here right now (not sales)? A rising rental-DOM trend means longer vacancies and softer asking-rent achievability than the comps imply.
- What's the recent tenant-quality profile in this submarket — average credit score on applications, eviction rate, late-payment / NSF rate, and stable-employment percentage? A property-management company in the area should have these aggregated.
CashFlowRE · CFR-W6T2RF00KMGAEY
· Data 6 days ago
cashflowre.app · 2026-05-29