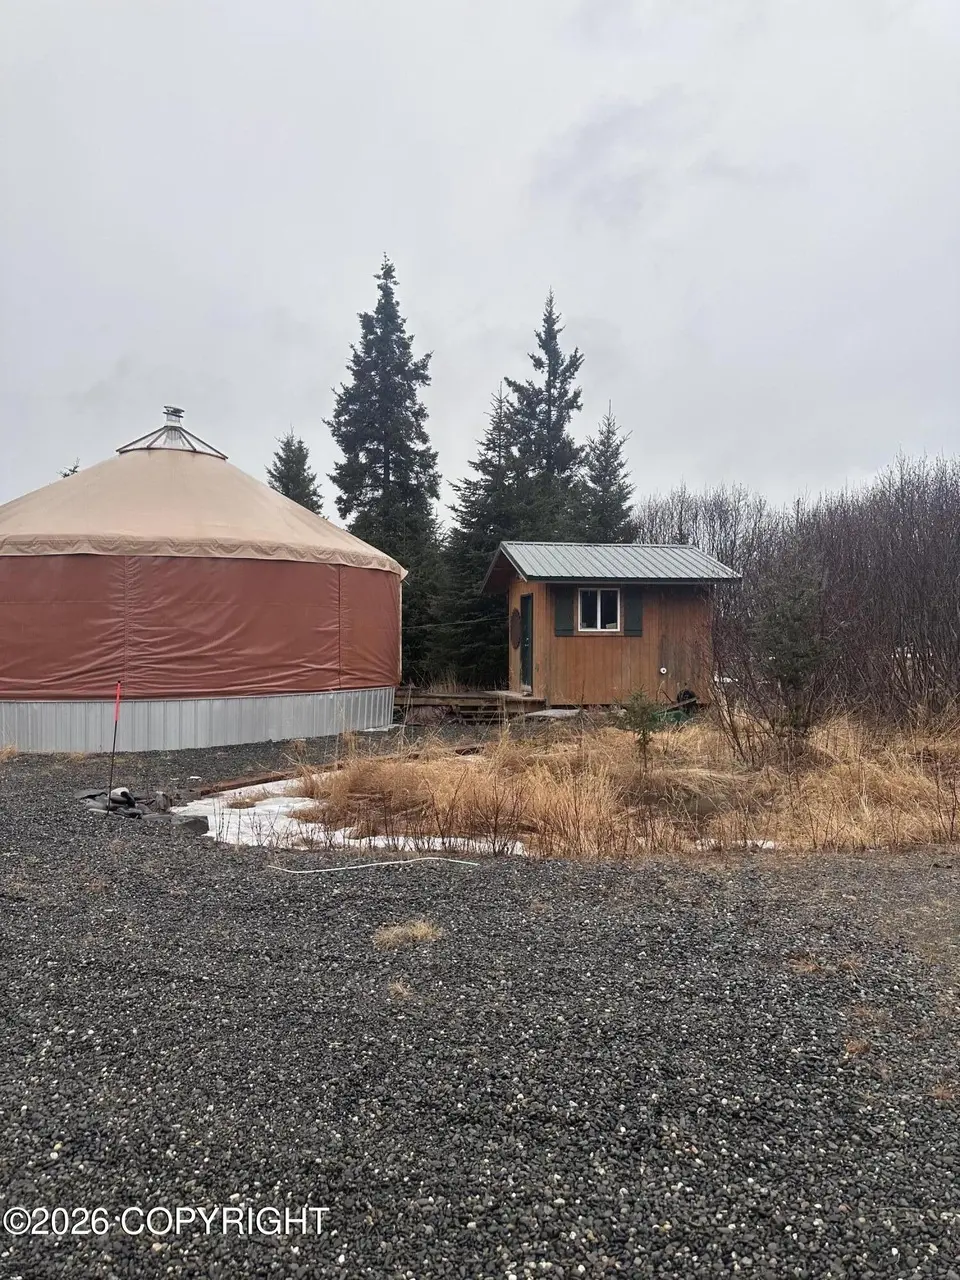
31862 Whiskey Gulch St
Anchor Point, AK 99556
$158,000D
1 bd · None ba ·
706 sqft ·
Built 2021
· Other
· Active
· 50 DOM
Cashflow @ list (25.0% down · 7.5%)
Estimated rent
$1,121/mo
Mortgage (P&I)
−$829
Tax + insurance
−$117
HOA
−$0
Vac / Maint / Mgmt
−$235
Net cashflow
$-59/mo
Annual
$-713/yr
Cap rate
5.84%
Cash-on-cash
-1.61%
DSCR
0.93
1% rule
0.71%
Cash to close
$44,240
Investor read
- This is a 1-bed/?-bath other listed at $158k.
- At list price, monthly cash flow is $-59 ($-713/yr) — negative.
- To cash-flow at today's rent, offer at most $148k (6.6% below list).
- To meet the 1% rule (rent ≥ 1% of price), the offer needs to be $112k (29.0% below list).
- It's been on market 50 days — a 3% lower offer ($153k) is reasonable based on typical stale-listing flexibility.
- Recommended offer: $112k (29.0% below list) — sets the bar for 1% rule.
- In year one you build about $5k of equity ($1k loan paydown + $4k appreciation (2.5% local appreciation)).
- Location reads 67/100 on livability (#23 in AK) — a middle-class / working-renter tenant base. Strengths: housing A+, health & safety A+, cost of living B; Watch: employment D+, amenities F, commute F.
- Kenai Peninsula Borough School District (rural): math 35% / reading 48% proficiency, ranked #8 of 21 in AK (top 38%) — families likely to look elsewhere, expect single-tenant / working-renter base with shorter leases.
- Zoned schools: Chapman School (math 32% / reading 52%, grade F, #70 of 156 statewide, top 46%, 160 students, 48% FRL); Homer Flex School (math 24% / reading 75%, grade D+, #10 of 61 statewide, top 15%, 36 students, 58% FRL) — zoned schools average 53% FRL vs 31% district-wide (22 pts higher); higher-poverty schools than district average — tighter screening recommended.
- Market conditions: 131 active listings in the ZIP; 152 units permitted in Kenai Peninsula Borough in 2024 (20 in 5+ unit buildings).
- Kenai Peninsula County population projected at +17% by 2050 — long-run rental-demand tailwind backs the buy-and-hold thesis.
- 3 sale attempts since 2y ago with the ask held roughly flat each time — persistent listings suggest the price (not the market) is what's stuck; bring a comps-based counter.
- At projected returns (2.5% appreciation + 3.0% rent growth), your $44k cash investment doubles in ~8 years — after that, you're playing with house money.
- By year 7, paydown + projected appreciation supports a ~$32k cash-out refi (75% LTV) — recoverable capital for the next deal without selling this one.
- Cap rate 5.8% vs local median 2.3% in Anchor Point — top-decile yield for the area; either an underpriced asset or a hidden risk that comps aren't pricing in. Stress-test before assuming the spread holds.
Questions for listing agent
- What do current leases actually rent for vs. the listed asking? Can we see a recent rent roll and the last 12 months of T-12 income?
- It's been on market 50 days. Have you received any prior offers? Is the seller open to a 29% concession, seller financing, or rate buy-down credit?
- Is there a deadline driving the sale (1031 exchange, divorce, estate, relocation)? That informs how much negotiation room exists.
- The area grade is low — what's the realistic commute time and amenity access for the typical tenant pool here? Any planned neighborhood developments (good or bad) we should know about?
- What's the average days-on-market for RENTAL listings here right now (not sales)? A rising rental-DOM trend means longer vacancies and softer asking-rent achievability than the comps imply.
- What's the recent tenant-quality profile in this submarket — average credit score on applications, eviction rate, late-payment / NSF rate, and stable-employment percentage? A property-management company in the area should have these aggregated.
- How much new for-sale + rental construction is in the pipeline within 1–3 miles? Heavy new supply typically softens prices + rents 12–24 months out; constrained supply supports both.
CashFlowRE · CFR-W7PMC3E845YSTF
· Data 1 day ago
cashflowre.app · 2026-05-29