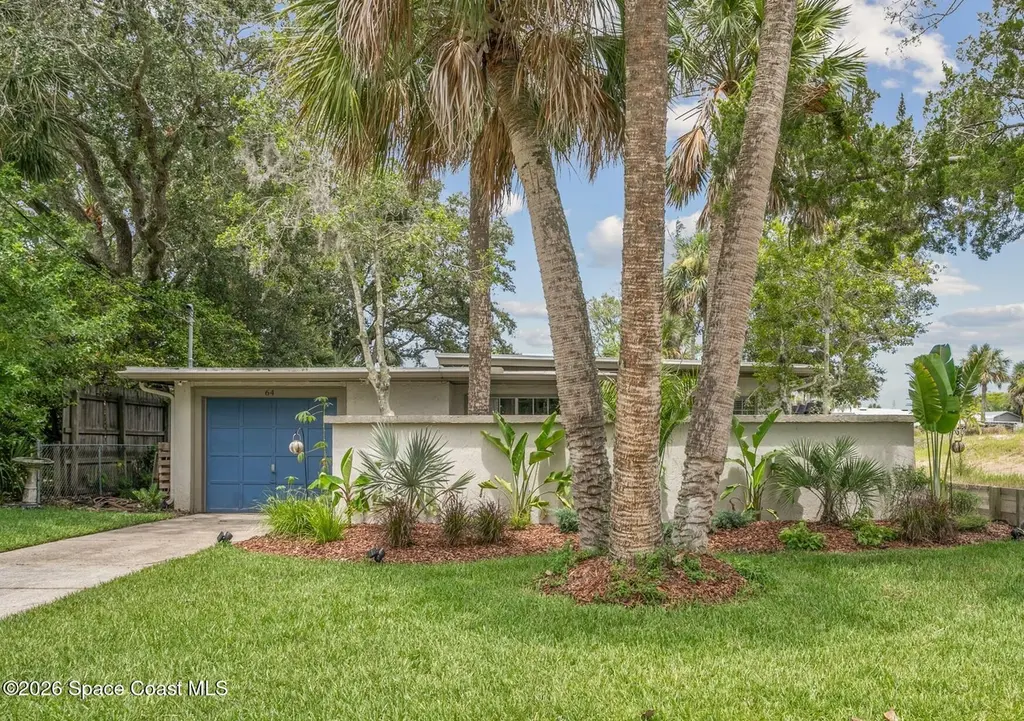
64 Dolphin Dr
St. Augustine, FL 32080
$529,000D+
3 bd · 2.0 ba ·
1,796 sqft ·
Built 1954
· SingleFamily
· Active
· 104 DOM
Cashflow @ list (25.0% down · 7.5%)
Estimated rent
$4,617/mo
Mortgage (P&I)
−$2,774
Tax + insurance
−$1,335
HOA
−$0
Vac / Maint / Mgmt
−$970
Net cashflow
$-461/mo
Annual
$-5,534/yr
Cap rate
6.21%
Cash-on-cash
-0.28%
DSCR
0.99
1% rule
0.87%
Cash to close
$148,120
Investor read
- This is a 3-bed/2.0-bath single-family listed at $529k.
- At list price, monthly cash flow is $-461 ($-6k/yr) — negative.
- To cash-flow at today's rent, offer at most $448k (15.4% below list).
- To meet the 1% rule (rent ≥ 1% of price), the offer needs to be $462k (12.7% below list).
- It's been on market 104 days — a 9% lower offer ($481k) is reasonable based on typical stale-listing flexibility.
- Recommended offer: $448k (15.4% below list) — sets the bar for cash-flow.
- Local home prices are declining (-3.0%/yr); year-one equity from $4k of loan paydown is wiped out by about $16k of value loss. Plan a longer hold.
- Location reads: area grade D — affects rentability + tenant quality, not the cash-flow math above.
- St. Johns (rural): math 75% / reading 73% proficiency, ranked #2 of 73 in FL (top 3%) — strong family-tenant draw, lease renewals of 3-5y typical; only 20% free/reduced lunch — higher-income household profile.
- Watch-outs: flood insurance adds $427/mo; built in 1954 — expect roof / HVAC / electrical / plumbing capex.
- Market conditions: Rents soft (-1.0%/yr); 534 active listings in the ZIP; 21 comparable units currently listed for rent nearby; rentals leasing fast (median 8d on market — plan ~1-2 weeks tenant-placement turnaround); solid renter incomes; 5,575 units permitted in St. Johns County in 2024 (584 in 5+ unit buildings).
- St. Johns County population projected at +60% by 2050 — long-run rental-demand tailwind backs the buy-and-hold thesis.
- 12 sale attempts since 8y ago; this cycle's ask has dropped $30k (5%) from the opening price — seller is motivated, your offer sets the floor, not the list.
- Climate carrying-cost: in FEMA flood zone AE (mandatory federal flood insurance); severe wind risk, 99% chance of damaging wind over 30y; extreme-heat days projected 7→20/yr by 2055 (HVAC capex compounding) — expect insurance premiums to compound above CPI over the hold.
- Cap rate 6.2% vs local median 3.1% in St. Augustine — top-decile yield for the area; either an underpriced asset or a hidden risk that comps aren't pricing in. Stress-test before assuming the spread holds.
- At $4,617/mo this rent would consume 60% of the median local household income ($93k/yr) (locally 417% of renters already pay >50% of income on rent) — very limited rent-growth headroom before tenants either downsize or default.
Questions for listing agent
- What do current leases actually rent for vs. the listed asking? Can we see a recent rent roll and the last 12 months of T-12 income?
- It's been on market 104 days. Have you received any prior offers? Is the seller open to a 15% concession, seller financing, or rate buy-down credit?
- Built in 1954 — when were the roof, HVAC, electrical panel, plumbing, and water heater last replaced?
- What's the actual annual flood-insurance premium (NFIP or private), and is the property in a SFHA with mandatory coverage?
- Why hasn't it sold? Are there any deal-killer items the seller is aware of (foundation, flood, title, zoning, code violations)?
- Is there a deadline driving the sale (1031 exchange, divorce, estate, relocation)? That informs how much negotiation room exists.
- The area grade is low — what's the realistic commute time and amenity access for the typical tenant pool here? Any planned neighborhood developments (good or bad) we should know about?
- What's the average days-on-market for RENTAL listings here right now (not sales)? A rising rental-DOM trend means longer vacancies and softer asking-rent achievability than the comps imply.
CashFlowRE · CFR-WA0TZ060VX78MP
· Data 2 days ago
cashflowre.app · 2026-05-29