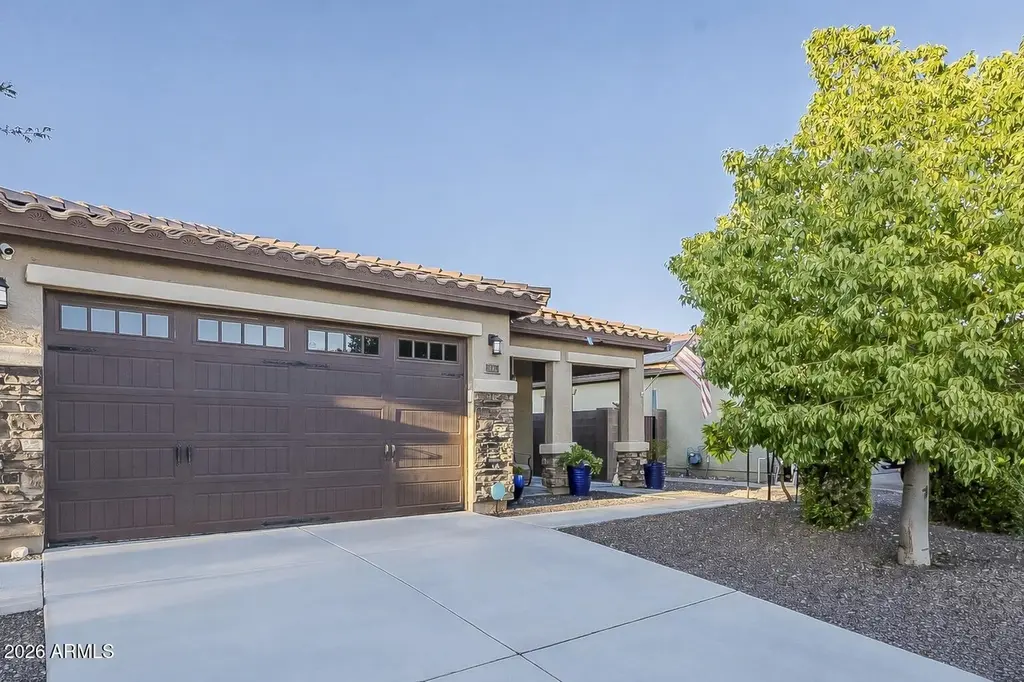
17170 W Butler Ave
Glendale, AZ 85355
$413,900D-
3 bd · 3.0 ba ·
1,753 sqft ·
Built 2017
· SingleFamily
· Active
· 96 DOM
Cashflow @ list (25.0% down · 7.5%)
Estimated rent
$2,991/mo
Mortgage (P&I)
−$2,171
Tax + insurance
−$291
HOA
−$126
Vac / Maint / Mgmt
−$628
Net cashflow
$-225/mo
Annual
$-2,695/yr
Cap rate
5.64%
Cash-on-cash
-2.33%
DSCR
0.90
1% rule
0.72%
Cash to close
$115,892
Investor read
- This is a 3-bed/3.0-bath single-family listed at $414k.
- At list price, monthly cash flow is $-225 ($-3k/yr) — negative.
- To cash-flow at today's rent, offer at most $374k (9.6% below list).
- To meet the 1% rule (rent ≥ 1% of price), the offer needs to be $299k (27.7% below list).
- It's been on market 96 days — a 9% lower offer ($377k) is reasonable based on typical stale-listing flexibility.
- Recommended offer: $299k (27.7% below list) — sets the bar for 1% rule.
- Local home prices are declining (-3.0%/yr); year-one equity from $3k of loan paydown is wiped out by about $12k of value loss. Plan a longer hold.
- Location reads 76/100 on livability (#12 in AZ, #3,235 nationally) — a middle-class / working-renter tenant base. Strengths: commute A+, housing A+, amenities B; Watch: health & safety D+, crime F.
- Dysart Unified District (4243) (suburban): math 34% / reading 40% proficiency, ranked #73 of 249 in AZ (top 29%) — families likely to look elsewhere, expect single-tenant / working-renter base with shorter leases.
- Zoned schools: Luke Elementary School (math 26% / reading 32%, grade F, #570 of 1,109 statewide, top 52%, 623 students, 55% FRL); Shadow Ridge High School (math 34% / reading 39%, grade F, #88 of 381 statewide, top 24%, 2,323 students, 21% FRL) — zoned schools at 38% FRL track the district average.
- Market conditions: Rents rising (+1.4%/yr); 456 active listings in the ZIP; 17 comparable units currently listed for rent nearby; rentals leasing fast (median 6d on market — plan ~1-2 weeks tenant-placement turnaround); high-income renter base; 36,011 units permitted in Maricopa County in 2024 (12,801 in 5+ unit buildings).
- Maricopa County population projected at +38% by 2050 — long-run rental-demand tailwind backs the buy-and-hold thesis.
- 2 sale attempts with the ask held roughly flat each time — persistent listings suggest the price (not the market) is what's stuck; bring a comps-based counter.
- Climate carrying-cost: moderate wildfire risk; extreme-heat days projected 7→18/yr by 2055 (HVAC capex compounding) — expect insurance premiums to compound above CPI over the hold.
- Cap rate 5.6% vs local median 3.5% in Glendale — top-decile yield for the area; either an underpriced asset or a hidden risk that comps aren't pricing in. Stress-test before assuming the spread holds.
Questions for listing agent
- What do current leases actually rent for vs. the listed asking? Can we see a recent rent roll and the last 12 months of T-12 income?
- It's been on market 96 days. Have you received any prior offers? Is the seller open to a 28% concession, seller financing, or rate buy-down credit?
- What does the HOA fee cover, when was the last increase, and are there any pending special assessments or reserve-fund shortfalls?
- Why hasn't it sold? Are there any deal-killer items the seller is aware of (foundation, flood, title, zoning, code violations)?
- Is there a deadline driving the sale (1031 exchange, divorce, estate, relocation)? That informs how much negotiation room exists.
- Crime grade is F in this area — have there been break-ins, vandalism, or insurance claims at this property in the last 3 years? What carrier currently insures it and at what premium?
- The area grade is low — what's the realistic commute time and amenity access for the typical tenant pool here? Any planned neighborhood developments (good or bad) we should know about?
- What's the average days-on-market for RENTAL listings here right now (not sales)? A rising rental-DOM trend means longer vacancies and softer asking-rent achievability than the comps imply.
CashFlowRE · CFR-WAD9WKB3BRA8VE
· Data 2 weeks ago
cashflowre.app · 2026-05-29