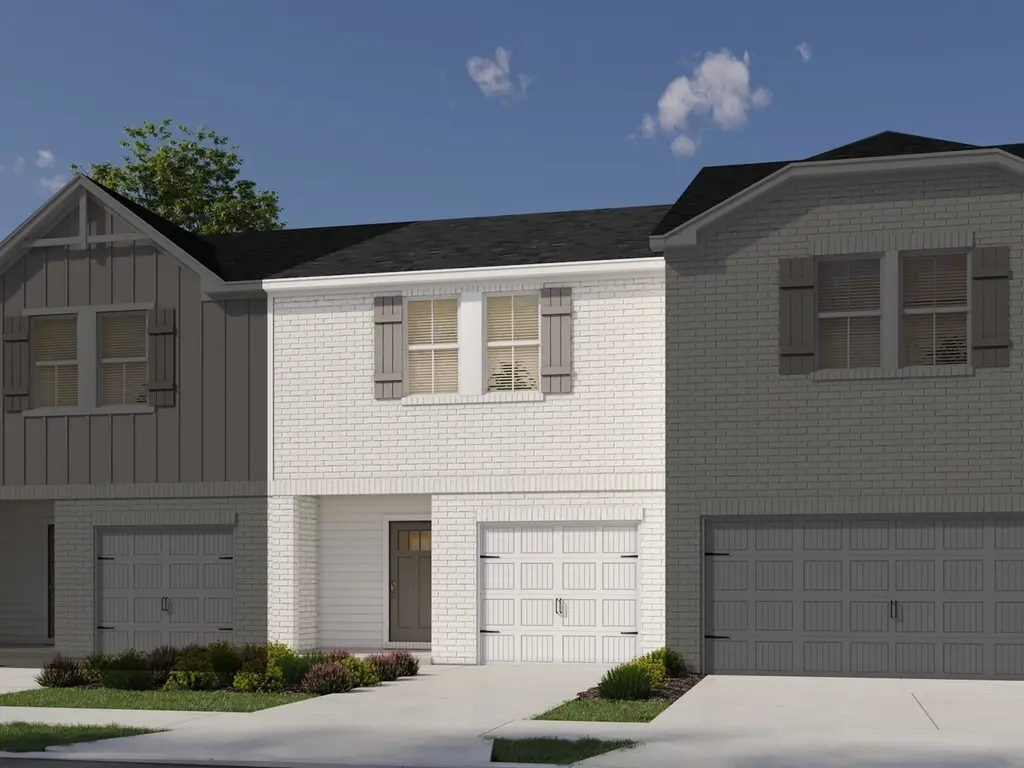
7209 Cedarcrest Ln
Fairview, TN 37062
$351,710D-
3 bd · 2.5 ba ·
1,646 sqft ·
Built 2026
· SingleFamily
· Active
· 48 DOM
Cashflow @ list (25.0% down · 7.5%)
Estimated rent
$2,402/mo
Mortgage (P&I)
−$1,844
Tax + insurance
−$586
HOA
−$0
Vac / Maint / Mgmt
−$504
Net cashflow
$-533/mo
Annual
$-6,401/yr
Cap rate
4.47%
Cash-on-cash
-6.50%
DSCR
0.71
1% rule
0.68%
Cash to close
$98,479
Investor read
- This is a 3-bed/2.5-bath single-family listed at $352k.
- At list price, monthly cash flow is $-533 ($-6k/yr) — negative.
- To cash-flow at today's rent, offer at most $275k (21.9% below list).
- To meet the 1% rule (rent ≥ 1% of price), the offer needs to be $240k (31.7% below list).
- It's been on market 48 days — a 3% lower offer ($341k) is reasonable based on typical stale-listing flexibility.
- Recommended offer: $240k (31.7% below list) — sets the bar for 1% rule.
- Local home prices are declining (-3.0%/yr); year-one equity from $2k of loan paydown is wiped out by about $11k of value loss. Plan a longer hold.
- Location reads 72/100 on livability (#31 in TN) — a middle-class / working-renter tenant base. Strengths: crime A+, housing A+, health & safety A; Watch: schools D+, amenities F, commute F.
- Williamson County (rural): math 58% / reading 59% proficiency, ranked #1 of 139 in TN (top 1%) — acceptable for families but not a draw, mixed tenant base, ~2y average lease; only 9% free/reduced lunch — higher-income household profile.
- Market conditions: 355 active listings in the ZIP; 8 comparable units currently listed for rent nearby; rentals lingering (median 44d on market — plan ~5-8 weeks vacancy on turnover, expect pricing pressure); 62% of comp listings sitting > 30 days — soft ceiling on asking rent; solid renter incomes; 1,994 units permitted in Williamson County in 2024 (637 in 5+ unit buildings).
- Williamson County population projected at +59% by 2050 — long-run rental-demand tailwind backs the buy-and-hold thesis.
- Cap rate 4.5% vs local median 1.8% in Fairview — top-decile yield for the area; either an underpriced asset or a hidden risk that comps aren't pricing in. Stress-test before assuming the spread holds.
- This rent runs 31% of the median local income ($92k/yr) — at the standard rent-burdened threshold; future hikes will face affordability resistance.
Questions for listing agent
- What do current leases actually rent for vs. the listed asking? Can we see a recent rent roll and the last 12 months of T-12 income?
- It's been on market 48 days. Have you received any prior offers? Is the seller open to a 32% concession, seller financing, or rate buy-down credit?
- Is there a deadline driving the sale (1031 exchange, divorce, estate, relocation)? That informs how much negotiation room exists.
- Schools are D-rated, which usually means shorter tenancies and higher turnover. Who's the typical renter profile here, and what's been the actual vacancy rate?
- The area grade is low — what's the realistic commute time and amenity access for the typical tenant pool here? Any planned neighborhood developments (good or bad) we should know about?
- What's the average days-on-market for RENTAL listings here right now (not sales)? A rising rental-DOM trend means longer vacancies and softer asking-rent achievability than the comps imply.
- What's the recent tenant-quality profile in this submarket — average credit score on applications, eviction rate, late-payment / NSF rate, and stable-employment percentage? A property-management company in the area should have these aggregated.
- How much new for-sale + rental construction is in the pipeline within 1–3 miles? Heavy new supply typically softens prices + rents 12–24 months out; constrained supply supports both.
CashFlowRE · CFR-WAFZ1BBWS3Q59T
· Data 2 days ago
cashflowre.app · 2026-05-29