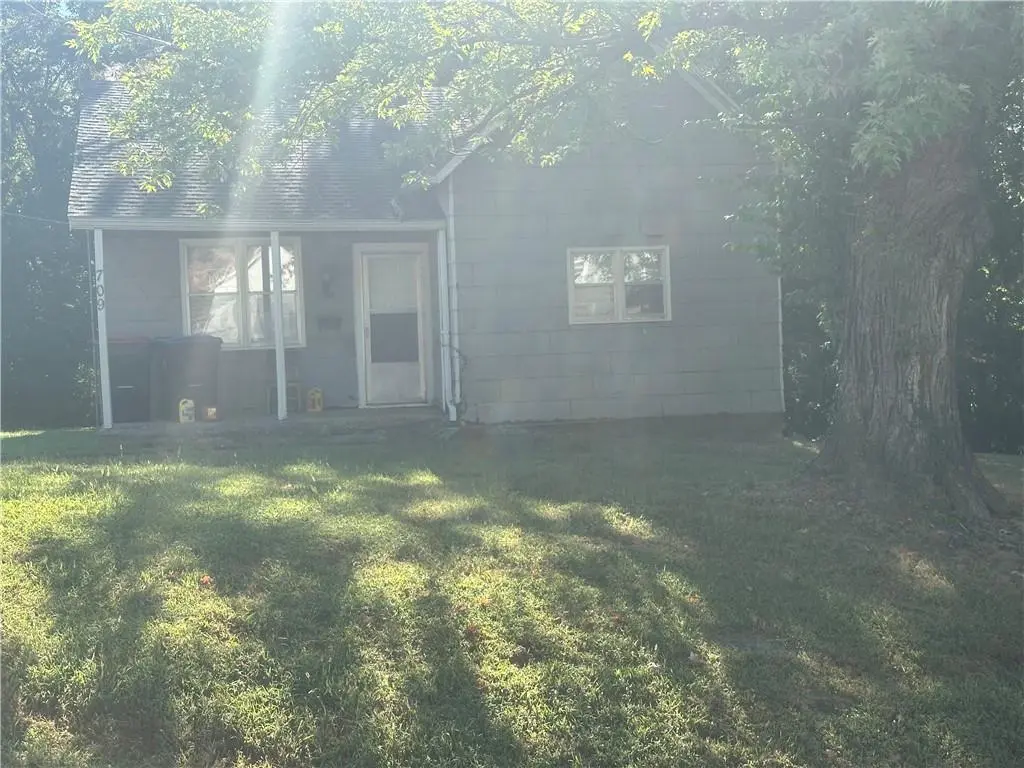
709 N Washington St
Warrensburg, MO 64093
$120,000B-
2 bd · 1.0 ba ·
1,036 sqft ·
Built 1910
· Other
· Active
· 106 DOM
Cashflow @ list (25.0% down · 7.5%)
Estimated rent
$1,234/mo
Mortgage (P&I)
−$629
Tax + insurance
−$103
HOA
−$0
Vac / Maint / Mgmt
−$259
Net cashflow
$243/mo
Annual
$2,919/yr
Cap rate
8.73%
Cash-on-cash
8.69%
DSCR
1.39
1% rule
1.03%
Cash to close
$33,600
Investor read
- This is a 2-bed/1.0-bath other listed at $120k.
- At list price, monthly cash flow is $243 ($3k/yr) — positive.
- The deal already cash-flows at list — no discount required.
- Meets the 1% rule at list price ($1k rent vs $120k).
- It's been on market 106 days — a 9% lower offer ($109k) is reasonable based on typical stale-listing flexibility.
- Recommended offer: $109k (9.0% below list) — sets the bar for market timing.
- Local home prices are declining (-3.0%/yr); year-one equity from $830 of loan paydown is wiped out by about $4k of value loss. Plan a longer hold.
- Location reads 74/100 on livability (#71 in MO, #4,801 nationally) — a middle-class / working-renter tenant base. Strengths: cost of living A+, housing A+, health & safety A; Watch: crime D+, employment D+, commute F.
- Warrensburg R-VI (town): math 30% / reading 45% proficiency, ranked #184 of 324 in MO (top 57%) — families likely to look elsewhere, expect single-tenant / working-renter base with shorter leases.
- Watch-outs: built in 1910 — expect roof / HVAC / electrical / plumbing capex.
- Market conditions: Rents rising fast (+6.7%/yr); 272 active listings in the ZIP; 13 comparable units currently listed for rent nearby; rentals lingering (median 45d on market — plan ~5-8 weeks vacancy on turnover, expect pricing pressure); 100% of comp listings sitting > 30 days — soft ceiling on asking rent; 80 units permitted in Johnson County in 2024 (27 in 5+ unit buildings).
- Johnson County population projected at +6% by 2050 — modest demand growth; plan on rents tracking national, not racing it.
- 2 sale attempts since 24y ago with the ask held roughly flat each time — persistent listings suggest the price (not the market) is what's stuck; bring a comps-based counter.
- At projected returns (-3.0% appreciation + 6.7% rent growth), your $34k cash investment doubles in ~9 years — after that, you're playing with house money.
- Cap rate 8.7% vs local median 3.2% in Warrensburg — top-decile yield for the area; either an underpriced asset or a hidden risk that comps aren't pricing in. Stress-test before assuming the spread holds.
Questions for listing agent
- It's been on market 106 days. Have you received any prior offers? Is the seller open to a 9% concession, seller financing, or rate buy-down credit?
- Built in 1910 — when were the roof, HVAC, electrical panel, plumbing, and water heater last replaced?
- Why hasn't it sold? Are there any deal-killer items the seller is aware of (foundation, flood, title, zoning, code violations)?
- Is there a deadline driving the sale (1031 exchange, divorce, estate, relocation)? That informs how much negotiation room exists.
- Schools are B-rated — typically a magnet for longer-tenancy family renters. What's the average tenant stay here, and is there a school-zone premium baked into asking?
- Crime grade is D in this area — have there been break-ins, vandalism, or insurance claims at this property in the last 3 years? What carrier currently insures it and at what premium?
- What's the average days-on-market for RENTAL listings here right now (not sales)? A rising rental-DOM trend means longer vacancies and softer asking-rent achievability than the comps imply.
- What's the recent tenant-quality profile in this submarket — average credit score on applications, eviction rate, late-payment / NSF rate, and stable-employment percentage? A property-management company in the area should have these aggregated.
CashFlowRE · CFR-WB1AEH2ZNQXFEP
· Data 50 min ago
cashflowre.app · 2026-05-29