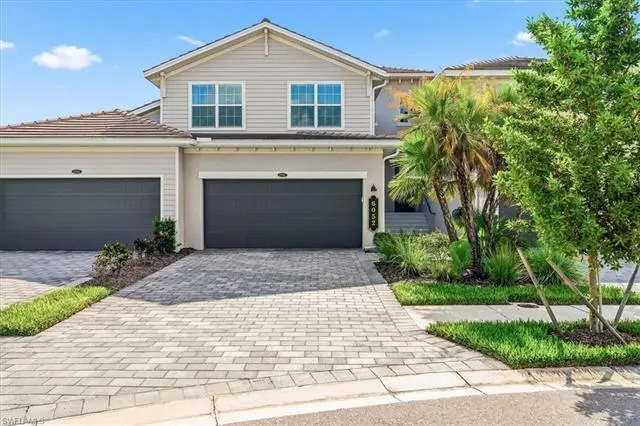
6052 Ellerston Way #1721
Ave Maria, FL 34142
$449,000D
3 bd · 2.0 ba ·
2,110 sqft ·
Built 2023
· Condo
· Active
· 2 DOM
Cashflow @ list (25.0% down · 7.5%)
Estimated rent
$4,838/mo
Mortgage (P&I)
−$2,355
Tax + insurance
−$730
HOA
−$1,190
Vac / Maint / Mgmt
−$1,016
Net cashflow
$-453/mo
Annual
$-5,432/yr
Cap rate
5.08%
Cash-on-cash
-4.32%
DSCR
0.81
1% rule
1.08%
Cash to close
$125,720
Investor read
- This is a 3-bed/2.0-bath condo listed at $449k.
- At list price, monthly cash flow is $-453 ($-5k/yr) — negative.
- To cash-flow at today's rent, offer at most $369k (17.8% below list).
- Meets the 1% rule at list price ($5k rent vs $449k).
- Only 2 days on market — expect competitive offers; lowballing is unlikely to land.
- Recommended offer: $369k (17.8% below list) — sets the bar for cash-flow.
- Local home prices are declining (-1.1%/yr); year-one equity from $3k of loan paydown is wiped out by about $5k of value loss. Plan a longer hold.
- Location reads: area grade D — affects rentability + tenant quality, not the cash-flow math above.
- Collier (suburban): math 60% / reading 56% proficiency, ranked #16 of 73 in FL (top 22%) — acceptable for families but not a draw, mixed tenant base, ~2y average lease.
- Zoned schools: Estates Elementary School (math 70% / reading 67%, grade B+, #409 of 2,144 statewide, top 20%, 862 students, 53% FRL); Corkscrew Middle School (math 68% / reading 59%, grade B+, #109 of 571 statewide, top 19%, 958 students, 43% FRL); Palmetto Ridge High School (math 43% / reading 51%, grade D-, #207 of 667 statewide, top 32%, 2,347 students, 38% FRL).
- Watch-outs: HOA is 25% of rent.
- Market conditions: Rents rising (+3.0%/yr); 453 active listings in the ZIP; 40 comparable units currently listed for rent nearby; rentals at typical pace (median 26d on market — plan ~3-4 weeks tenant-placement turnaround); 3,520 units permitted in Collier County in 2024 (959 in 5+ unit buildings).
- Collier County population projected at +30% by 2050 — long-run rental-demand tailwind backs the buy-and-hold thesis.
- 2 sale attempts since 2y ago with the ask held roughly flat each time — persistent listings suggest the price (not the market) is what's stuck; bring a comps-based counter.
- At $4,838/mo this rent would consume 93% of the median local household income ($62k/yr) (locally 1093% of renters already pay >50% of income on rent) — very limited rent-growth headroom before tenants either downsize or default.
Questions for listing agent
- What do current leases actually rent for vs. the listed asking? Can we see a recent rent roll and the last 12 months of T-12 income?
- What does the HOA fee cover, when was the last increase, and are there any pending special assessments or reserve-fund shortfalls?
- Any open or pending special assessments — roof, HVAC, plumbing, elevator, façade? What's the per-unit balance and payoff schedule, and is the seller paying it off at close or rolling it to the buyer?
- Is there a deadline driving the sale (1031 exchange, divorce, estate, relocation)? That informs how much negotiation room exists.
- The area grade is low — what's the realistic commute time and amenity access for the typical tenant pool here? Any planned neighborhood developments (good or bad) we should know about?
- What's the average days-on-market for RENTAL listings here right now (not sales)? A rising rental-DOM trend means longer vacancies and softer asking-rent achievability than the comps imply.
- What's the recent tenant-quality profile in this submarket — average credit score on applications, eviction rate, late-payment / NSF rate, and stable-employment percentage? A property-management company in the area should have these aggregated.
- How much new apartment / multifamily construction is in the pipeline within 1–3 miles? Heavy new supply (>2% of stock underway) typically softens rents 12–24 months out; light construction supports rent growth.
CashFlowRE · CFR-WB1VR3FFYSKGG1
· Data 15 h ago
cashflowre.app · 2026-05-29