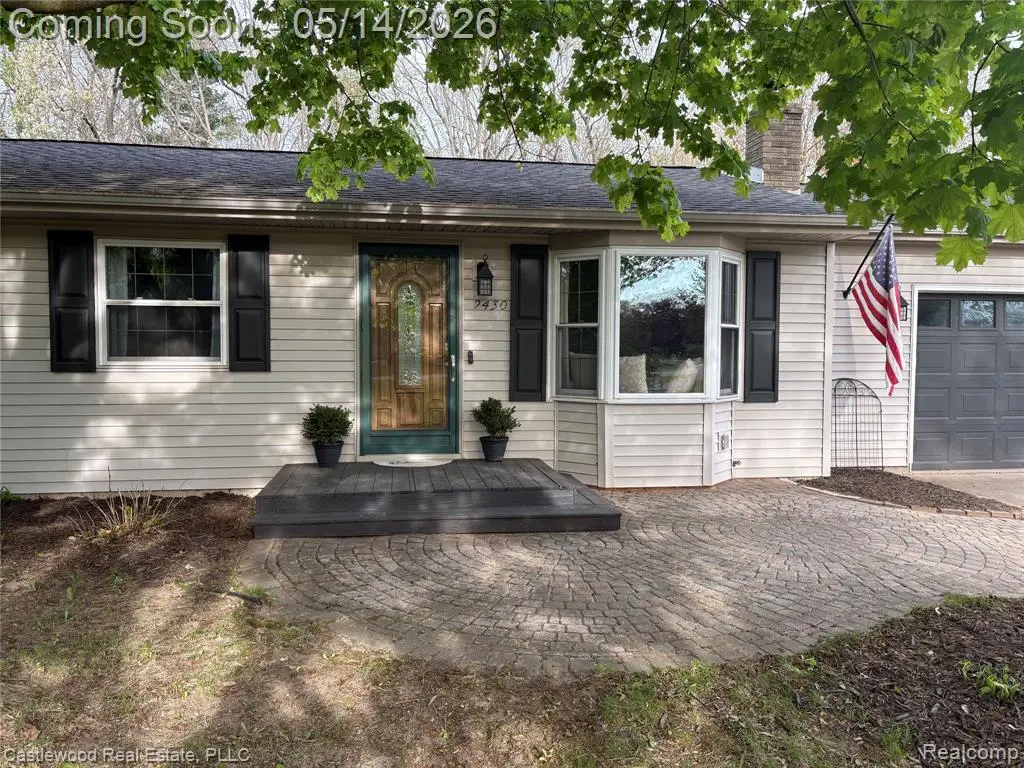
2430 Virginia Park Dr
Lapeer, MI 48446
$230,000D-
3 bd · 1.0 ba ·
960 sqft ·
Built 1972
· SingleFamily
· Pending
· 14 DOM
Cashflow @ list (25.0% down · 7.5%)
Estimated rent
$1,488/mo
Mortgage (P&I)
−$1,206
Tax + insurance
−$245
HOA
−$0
Vac / Maint / Mgmt
−$313
Net cashflow
$-275/mo
Annual
$-3,305/yr
Cap rate
4.86%
Cash-on-cash
-5.13%
DSCR
0.77
1% rule
0.65%
Cash to close
$64,400
Investor read
- This is a 3-bed/1.0-bath single-family listed at $230k.
- At list price, monthly cash flow is $-275 ($-3k/yr) — negative.
- To cash-flow at today's rent, offer at most $181k (21.2% below list).
- To meet the 1% rule (rent ≥ 1% of price), the offer needs to be $149k (35.3% below list).
- Only 14 days on market — expect competitive offers; lowballing is unlikely to land.
- Recommended offer: $149k (35.3% below list) — sets the bar for 1% rule.
- Local home prices are declining (-3.0%/yr); year-one equity from $2k of loan paydown is wiped out by about $7k of value loss. Plan a longer hold.
- Location reads 72/100 on livability (#231 in MI) — a middle-class / working-renter tenant base. Strengths: cost of living A+, housing A+, health & safety A-; Watch: employment D, commute F.
- Lapeer Community Schools (town): math 31% / reading 49% proficiency, ranked #202 of 540 in MI (top 37%) — families likely to look elsewhere, expect single-tenant / working-renter base with shorter leases.
- Zoned schools: Elva Lynch Elementary School (math 32% / reading 42%, grade F, #685 of 1,397 statewide, top 51%, 421 students, 58% FRL); Rolland Warner Campus 67 (math 25% / reading 39%, grade F, #317 of 493 statewide, top 65%, 576 students, 58% FRL); Lapeer High School (math 29% / reading 55%, grade F, #264 of 713 statewide, top 41%, 1,196 students, 41% FRL).
- Market conditions: 196 active listings in the ZIP; 152 units permitted in Lapeer County in 2024 (0 in 5+ unit buildings).
- Lapeer County population projected at -10% by 2050 — secular population decline; favor cash flow + early exit over multi-decade hold.
- 7 sale attempts since 26y ago with the ask held roughly flat each time — persistent listings suggest the price (not the market) is what's stuck; bring a comps-based counter.
- Cap rate 4.9% vs local median 3.5% in Lapeer — top-decile yield for the area; either an underpriced asset or a hidden risk that comps aren't pricing in. Stress-test before assuming the spread holds.
Questions for listing agent
- What do current leases actually rent for vs. the listed asking? Can we see a recent rent roll and the last 12 months of T-12 income?
- Built in 1972 — when were the roof, HVAC, electrical panel, plumbing, and water heater last replaced?
- Is there a deadline driving the sale (1031 exchange, divorce, estate, relocation)? That informs how much negotiation room exists.
- Schools are D-rated, which usually means shorter tenancies and higher turnover. Who's the typical renter profile here, and what's been the actual vacancy rate?
- The area grade is low — what's the realistic commute time and amenity access for the typical tenant pool here? Any planned neighborhood developments (good or bad) we should know about?
- What's the average days-on-market for RENTAL listings here right now (not sales)? A rising rental-DOM trend means longer vacancies and softer asking-rent achievability than the comps imply.
- What's the recent tenant-quality profile in this submarket — average credit score on applications, eviction rate, late-payment / NSF rate, and stable-employment percentage? A property-management company in the area should have these aggregated.
- How much new for-sale + rental construction is in the pipeline within 1–3 miles? Heavy new supply typically softens prices + rents 12–24 months out; constrained supply supports both.
CashFlowRE · CFR-WERPPTFFX9V493
· Data 3 weeks ago
cashflowre.app · 2026-05-29