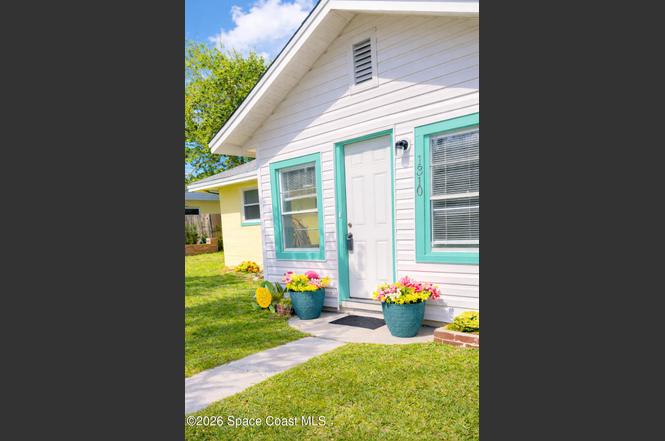
1310 Jernigan Ave
Melbourne, FL 32901
$240,000D
3 bd · 1.0 ba ·
1,728 sqft ·
Built 1950
· SingleFamily
· Pending
· 269 DOM
Cashflow @ list (25.0% down · 7.5%)
Estimated rent
$2,015/mo
Mortgage (P&I)
−$1,259
Tax + insurance
−$348
HOA
−$0
Vac / Maint / Mgmt
−$423
Net cashflow
$-15/mo
Annual
$-177/yr
Cap rate
6.22%
Cash-on-cash
-0.26%
DSCR
0.99
1% rule
0.84%
Cash to close
$67,200
Investor read
- This is a 3-bed/1.0-bath single-family listed at $240k.
- At list price, monthly cash flow is $-15 ($-177/yr) — negative.
- To cash-flow at today's rent, offer at most $237k (1.1% below list).
- To meet the 1% rule (rent ≥ 1% of price), the offer needs to be $201k (16.1% below list).
- It's been on market 269 days — a 12% lower offer ($211k) is reasonable based on typical stale-listing flexibility.
- Recommended offer: $201k (16.1% below list) — sets the bar for 1% rule.
- Local home prices are declining (-3.0%/yr); year-one equity from $2k of loan paydown is wiped out by about $7k of value loss. Plan a longer hold.
- Location reads: area grade D — affects rentability + tenant quality, not the cash-flow math above.
- Brevard (suburban): math 53% / reading 57% proficiency, ranked #19 of 73 in FL (top 26%) — acceptable for families but not a draw, mixed tenant base, ~2y average lease.
- Zoned schools: University Park Elementary School (math 22% / reading 32%, grade F, #1,969 of 2,144 statewide, top 94%, 484 students, 76% FRL); Stone Magnet Middle School (math 33% / reading 35%, grade F, #426 of 571 statewide, top 75%, 670 students, 69% FRL); Melbourne Senior High School (math 43% / reading 57%, grade D+, #175 of 667 statewide, top 27%, 2,249 students, 31% FRL) — zoned schools average 59% FRL vs 43% district-wide (16 pts higher); higher-poverty schools than district average — tighter screening recommended.
- Zoned-school proficiency averages 37% at this address vs 55% district-wide (-18 pts) — the specific schools serving this property underperform the Brevard average; the district grade overstates school quality for this exact location.
- Watch-outs: built in 1950 — expect roof / HVAC / electrical / plumbing capex.
- Market conditions: Rents rising (+1.7%/yr); 202 active listings in the ZIP; 16 comparable units currently listed for rent nearby; rentals at typical pace (median 24d on market — plan ~3-4 weeks tenant-placement turnaround); 4,602 units permitted in Brevard County in 2024 (702 in 5+ unit buildings).
- Brevard County population projected at +15% by 2050 — modest demand growth; plan on rents tracking national, not racing it.
- 7 sale attempts; this cycle's ask has dropped $30k (11%) from the opening price — seller is motivated, your offer sets the floor, not the list.
- Current owner paid $88k; list at $240k implies a 173% gain — meaningful room to come down on a strong offer.
- Climate carrying-cost: major flood risk; severe wind risk, 99% chance of damaging wind over 30y; extreme-heat days projected 7→23/yr by 2055 (HVAC capex compounding) — expect insurance premiums to compound above CPI over the hold.
- This rent runs 44% of the median local income ($55k/yr) — at the standard rent-burdened threshold; future hikes will face affordability resistance.
Questions for listing agent
- What do current leases actually rent for vs. the listed asking? Can we see a recent rent roll and the last 12 months of T-12 income?
- It's been on market 269 days. Have you received any prior offers? Is the seller open to a 16% concession, seller financing, or rate buy-down credit?
- Built in 1950 — when were the roof, HVAC, electrical panel, plumbing, and water heater last replaced?
- Why hasn't it sold? Are there any deal-killer items the seller is aware of (foundation, flood, title, zoning, code violations)?
- Is there a deadline driving the sale (1031 exchange, divorce, estate, relocation)? That informs how much negotiation room exists.
- The area grade is low — what's the realistic commute time and amenity access for the typical tenant pool here? Any planned neighborhood developments (good or bad) we should know about?
- What's the average days-on-market for RENTAL listings here right now (not sales)? A rising rental-DOM trend means longer vacancies and softer asking-rent achievability than the comps imply.
- What's the recent tenant-quality profile in this submarket — average credit score on applications, eviction rate, late-payment / NSF rate, and stable-employment percentage? A property-management company in the area should have these aggregated.
CashFlowRE · CFR-WF1PP6EBX65S7A
· Data 3 weeks ago
cashflowre.app · 2026-05-29