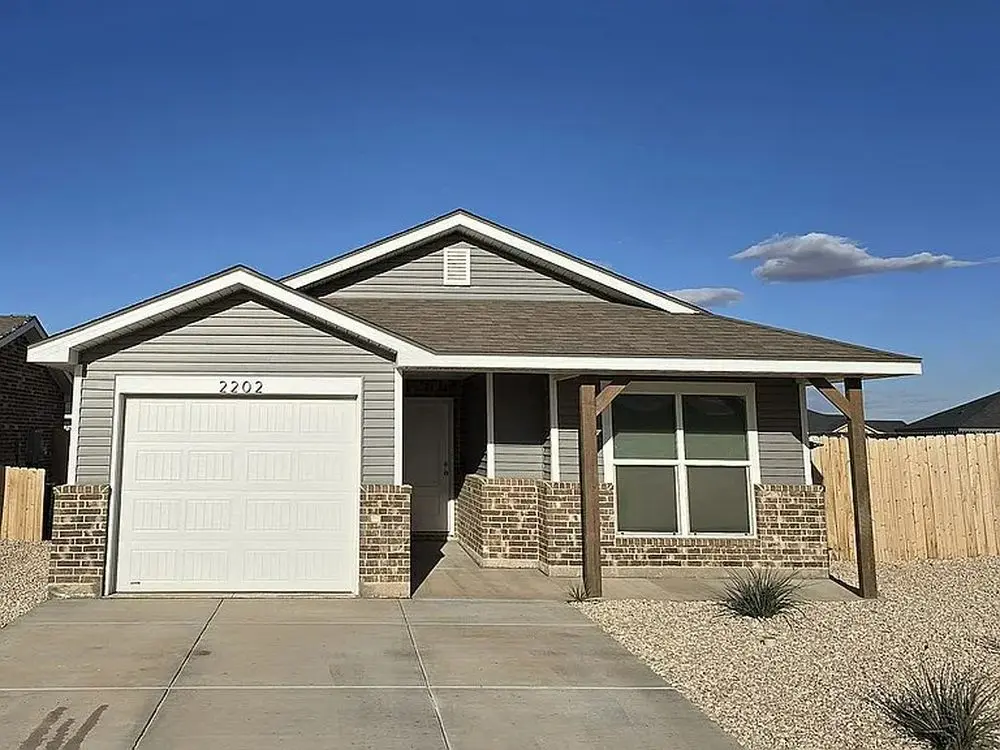
2202 High Country Cir
Midland, TX 79705
$244,900D+
2 bd · 2.0 ba ·
1,005 sqft ·
Built 2024
· SingleFamily
· Active
· 108 DOM
Cashflow @ list (25.0% down · 7.5%)
Estimated rent
$2,263/mo
Mortgage (P&I)
−$1,284
Tax + insurance
−$332
HOA
−$0
Vac / Maint / Mgmt
−$475
Net cashflow
$172/mo
Annual
$2,067/yr
Cap rate
7.14%
Cash-on-cash
3.01%
DSCR
1.13
1% rule
0.92%
Cash to close
$68,572
Investor read
- This is a 2-bed/2.0-bath single-family listed at $245k. Condition is rated good.
- At list price, monthly cash flow is $172 ($2k/yr) — positive.
- The deal already cash-flows at list — no discount required.
- To meet the 1% rule (rent ≥ 1% of price), the offer needs to be $226k (7.6% below list).
- It's been on market 108 days — a 9% lower offer ($223k) is reasonable based on typical stale-listing flexibility.
- Recommended offer: $223k (9.0% below list) — sets the bar for market timing.
- Local home prices are declining (-3.0%/yr); year-one equity from $2k of loan paydown is wiped out by about $7k of value loss. Plan a longer hold.
- Location reads 79/100 on livability (#57 in TX, #2,192 nationally) — a middle-class / working-renter tenant base. Strengths: employment A+, housing A+, health & safety A+; Watch: crime C-, commute D+, amenities D.
- Midland ISD (urban): math 34% / reading 36% proficiency, ranked #477 of 826 in TX (top 58%) — families likely to look elsewhere, expect single-tenant / working-renter base with shorter leases.
- Zoned schools: Santa Rita El (math 43% / reading 39%, grade F, #1,462 of 4,322 statewide, top 34%, 596 students, 45% FRL); Goddard J H (math 23% / reading 32%, grade F, #1,156 of 1,662 statewide, top 71%, 1,024 students, 58% FRL, charter); Midland H S (math 37% / reading 7%, grade F, #1,366 of 1,632 statewide, top 84%, 2,492 students, 44% FRL) — zoned schools at 49% FRL track the district average.
- Market conditions: Rents rising (+2.6%/yr); 452 active listings in the ZIP; 16 comparable units currently listed for rent nearby; rentals at typical pace (median 23d on market — plan ~3-4 weeks tenant-placement turnaround); solid renter incomes; 1,504 units permitted in Midland County in 2024 (0 in 5+ unit buildings).
- Midland County population projected at +83% by 2050 — long-run rental-demand tailwind backs the buy-and-hold thesis.
- Cap rate 7.1% vs local median 4.7% in Midland — top-decile yield for the area; either an underpriced asset or a hidden risk that comps aren't pricing in. Stress-test before assuming the spread holds.
Questions for listing agent
- It's been on market 108 days. Have you received any prior offers? Is the seller open to a 9% concession, seller financing, or rate buy-down credit?
- Why hasn't it sold? Are there any deal-killer items the seller is aware of (foundation, flood, title, zoning, code violations)?
- Is there a deadline driving the sale (1031 exchange, divorce, estate, relocation)? That informs how much negotiation room exists.
- The area grade is low — what's the realistic commute time and amenity access for the typical tenant pool here? Any planned neighborhood developments (good or bad) we should know about?
- What's the average days-on-market for RENTAL listings here right now (not sales)? A rising rental-DOM trend means longer vacancies and softer asking-rent achievability than the comps imply.
- What's the recent tenant-quality profile in this submarket — average credit score on applications, eviction rate, late-payment / NSF rate, and stable-employment percentage? A property-management company in the area should have these aggregated.
- How much new for-sale + rental construction is in the pipeline within 1–3 miles? Heavy new supply typically softens prices + rents 12–24 months out; constrained supply supports both.
CashFlowRE · CFR-WJKCY59N7J1KHJ
· Data 4 h ago
cashflowre.app · 2026-05-29