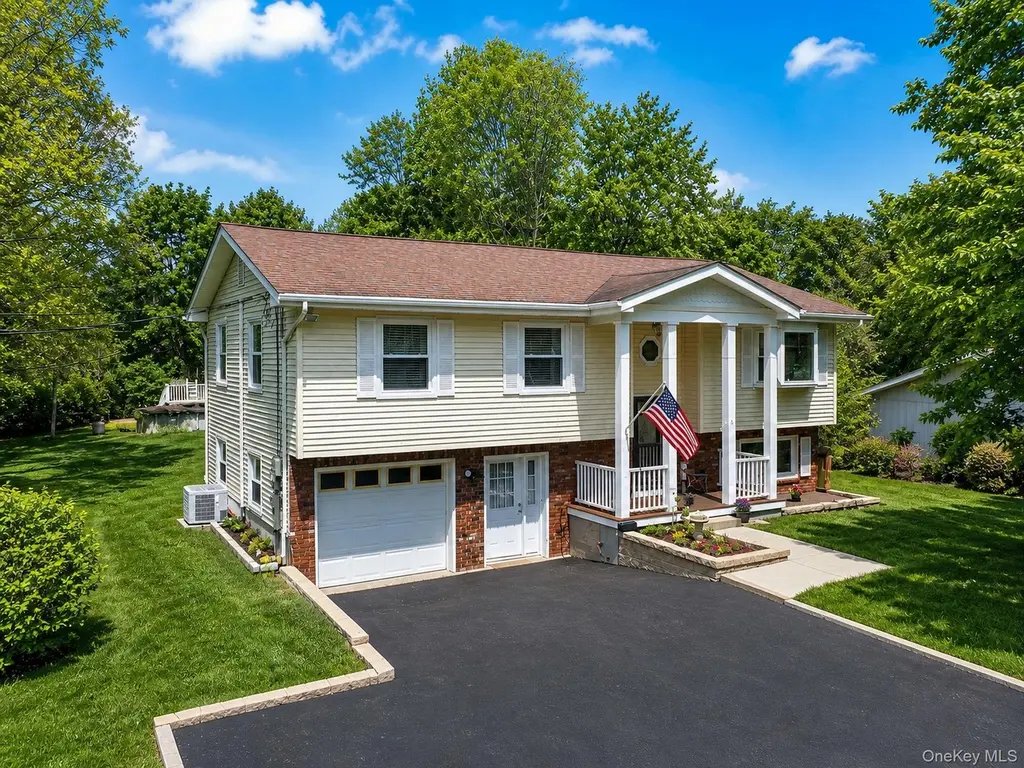
14 Foxwood Dr
Gardnertown, NY 12550
$474,900B-
4 bd · 3.0 ba ·
2,106 sqft ·
Built 1974
· MultiFamily
· Pending
· 14 DOM
Cashflow @ list (25.0% down · 7.5%)
Estimated rent
$5,659/mo
Mortgage (P&I)
−$2,490
Tax + insurance
−$869
HOA
−$0
Vac / Maint / Mgmt
−$1,188
Net cashflow
$1,111/mo
Annual
$13,335/yr
Cap rate
9.10%
Cash-on-cash
10.03%
DSCR
1.45
1% rule
1.19%
Cash to close
$132,972
Investor read
- This is a 4-bed/3.0-bath multifamily listed at $475k.
- At list price, monthly cash flow is $1k ($13k/yr) — positive.
- The deal already cash-flows at list — no discount required.
- Meets the 1% rule at list price ($6k rent vs $475k).
- Only 14 days on market — expect competitive offers; lowballing is unlikely to land.
- Local home prices are declining (-3.0%/yr); year-one equity from $3k of loan paydown is wiped out by about $14k of value loss. Plan a longer hold.
- Location reads 68/100 on livability (#522 in NY) — a middle-class / working-renter tenant base. Strengths: employment A+, housing A+, health & safety A; Watch: cost of living D, amenities F, commute F.
- Newburgh City School District (suburban): math 33% / reading 48% proficiency, ranked #500 of 590 in NY (top 85%) — families likely to look elsewhere, expect single-tenant / working-renter base with shorter leases; 61% free/reduced lunch — lower-income household profile, screen leases tightly.
- Zoned schools: Meadow Hill Global Explorations Magnet School (math 24% / reading 47%, grade F, #1,566 of 2,108 statewide, top 74%, 1,013 students, 58% FRL); Newburgh Free Academy (math 76% / reading 85%, grade A, #506 of 1,100 statewide, top 46%, 3,433 students, 56% FRL) — zoned schools at 57% FRL track the district average.
- Zoned-school proficiency averages 58% at this address vs 40% district-wide (+18 pts) — the actual schools serving this property are materially stronger than the Newburgh City School District average implies; a family-tenant draw the district grade alone would hide.
- Market conditions: Rents flat; 383 active listings in the ZIP; solid renter incomes; 1,746 units permitted in Orange County in 2024 (1,265 in 5+ unit buildings).
- 3 sale attempts since 11y ago with the ask held roughly flat each time — persistent listings suggest the price (not the market) is what's stuck; bring a comps-based counter.
- Current owner paid $255k; list at $475k implies a 86% gain — meaningful room to come down on a strong offer.
- Cap rate 9.1% vs local median 3.4% in Gardnertown — top-decile yield for the area; either an underpriced asset or a hidden risk that comps aren't pricing in. Stress-test before assuming the spread holds.
- At $5,659/mo this rent would consume 79% of the median local household income ($86k/yr) (locally 2412% of renters already pay >50% of income on rent) — very limited rent-growth headroom before tenants either downsize or default.
Questions for listing agent
- Built in 1974 — when were the roof, HVAC, electrical panel, plumbing, and water heater last replaced?
- Is there a deadline driving the sale (1031 exchange, divorce, estate, relocation)? That informs how much negotiation room exists.
- Schools are D-rated, which usually means shorter tenancies and higher turnover. Who's the typical renter profile here, and what's been the actual vacancy rate?
- What's the average days-on-market for RENTAL listings here right now (not sales)? A rising rental-DOM trend means longer vacancies and softer asking-rent achievability than the comps imply.
- What's the recent tenant-quality profile in this submarket — average credit score on applications, eviction rate, late-payment / NSF rate, and stable-employment percentage? A property-management company in the area should have these aggregated.
- How much new apartment / multifamily construction is in the pipeline within 1–3 miles? Heavy new supply (>2% of stock underway) typically softens rents 12–24 months out; light construction supports rent growth.
CashFlowRE · CFR-WNMC26581CEWXF
· Data 2 days ago
cashflowre.app · 2026-05-29