9162 Segers Rd
Madison, AL 35756
$40,000D
3 bd · 2.0 ba ·
980 sqft ·
Built 2018
· SingleFamily
· Active
· 1 DOM
Cashflow @ list (25.0% down · 7.5%)
Estimated rent
$1,912/mo
Mortgage (P&I)
−$210
Tax + insurance
−$67
HOA
−$0
Vac / Maint / Mgmt
−$402
Net cashflow
$1,234/mo
Annual
$14,813/yr
Cap rate
43.32%
Cash-on-cash
132.26%
DSCR
6.88
1% rule
4.78%
Cash to close
$11,200
Investor read
- This is a 3-bed/2.0-bath single-family listed at $40k. Condition is rated average.
- At list price, monthly cash flow is $1k ($15k/yr) — positive.
- The deal already cash-flows at list — no discount required.
- Meets the 1% rule at list price ($2k rent vs $40k).
- Only 1 days on market — expect competitive offers; lowballing is unlikely to land.
- Local home prices are declining (-3.0%/yr); year-one equity from $277 of loan paydown is wiped out by about $1k of value loss. Plan a longer hold.
- Location reads 76/100 on livability (#12 in AL, #3,280 nationally) — a middle-class / working-renter tenant base. Strengths: employment A+, housing A+, crime B+; Watch: amenities F, commute F.
- Limestone County (rural): math 21% / reading 44% proficiency, ranked #52 of 129 in AL (top 40%) — families likely to look elsewhere, expect single-tenant / working-renter base with shorter leases.
- Zoned schools: Tanner Elementary School (math 12% / reading 42%, grade F, #392 of 627 statewide, top 65%, 333 students, 73% FRL); Tanner High School (math 10% / reading 20%, grade F, #212 of 305 statewide, top 70%, 411 students, 85% FRL) — zoned schools average 79% FRL vs 40% district-wide (38 pts higher); higher-poverty schools than district average — tighter screening recommended.
- Market conditions: Rents rising (+1.1%/yr); 823 active listings in the ZIP; 1 comparable units currently listed for rent nearby; high-income renter base; 494 units permitted in Limestone County in 2024 (0 in 5+ unit buildings).
- Limestone County population projected at +43% by 2050 — long-run rental-demand tailwind backs the buy-and-hold thesis.
- At projected returns (-3.0% appreciation + 1.1% rent growth), your $11k cash investment doubles in ~1 year — after that, you're playing with house money.
- Cap rate 43.3% vs local median 2.6% in Madison — top-decile yield for the area; either an underpriced asset or a hidden risk that comps aren't pricing in. Stress-test before assuming the spread holds.
- This rent is only 18% of the median local income ($130k/yr) — well below the 30% rent-burden line; pricing power to push rent on renewal without tenant pushback.
Questions for listing agent
- Is there a deadline driving the sale (1031 exchange, divorce, estate, relocation)? That informs how much negotiation room exists.
- Schools are A-rated — typically a magnet for longer-tenancy family renters. What's the average tenant stay here, and is there a school-zone premium baked into asking?
- The area grade is low — what's the realistic commute time and amenity access for the typical tenant pool here? Any planned neighborhood developments (good or bad) we should know about?
- What's the average days-on-market for RENTAL listings here right now (not sales)? A rising rental-DOM trend means longer vacancies and softer asking-rent achievability than the comps imply.
- What's the recent tenant-quality profile in this submarket — average credit score on applications, eviction rate, late-payment / NSF rate, and stable-employment percentage? A property-management company in the area should have these aggregated.
- How much new for-sale + rental construction is in the pipeline within 1–3 miles? Heavy new supply typically softens prices + rents 12–24 months out; constrained supply supports both.
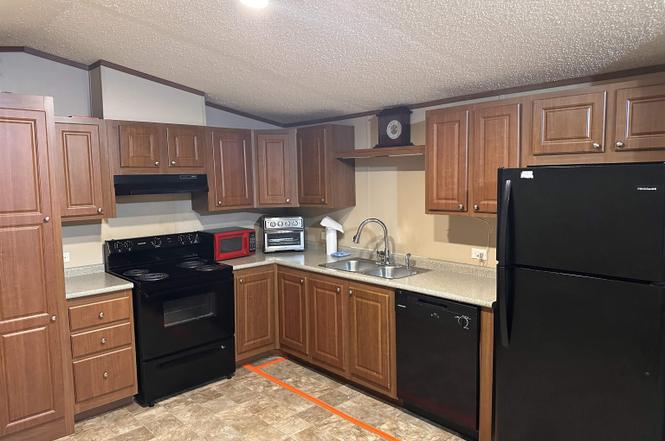
Repairs flagged (vision-AI assessment)
- Minor: Kitchen cabinets — Worn appearance
- Minor: Bathroom fixtures — Dated appearance
- Minor: Flooring — Signs of wear
CashFlowRE · CFR-WSJS0M0DR55C64
· Data 2 days ago
cashflowre.app · 2026-05-29