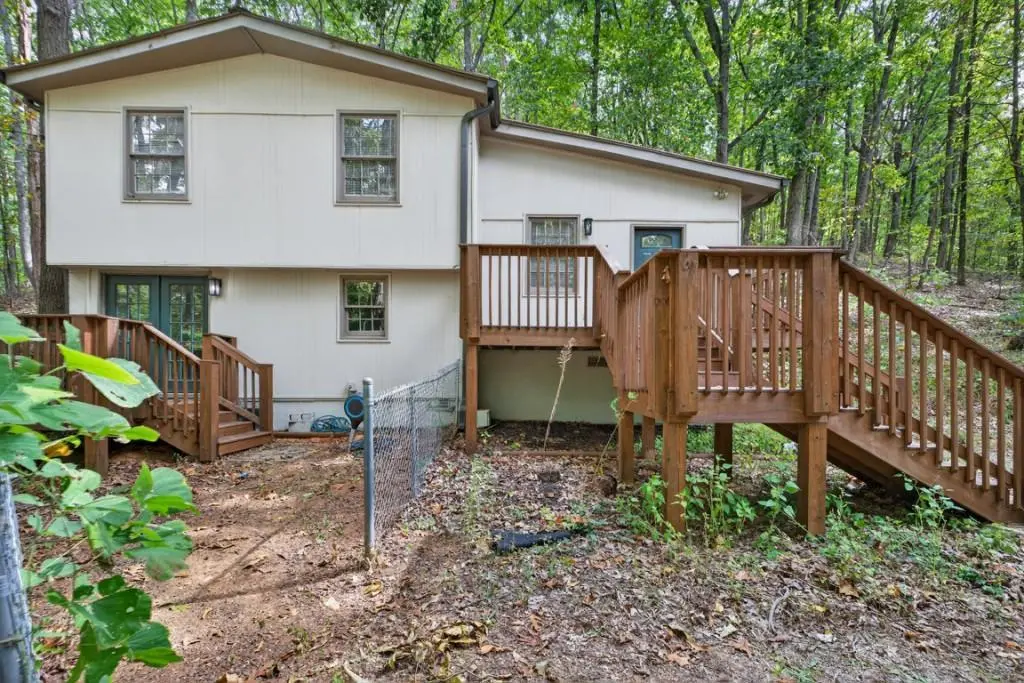
256 Robin Hood Ln
Fairmount, GA 30139
$230,000D
3 bd · 2.0 ba ·
1,400 sqft ·
Built 1994
· SingleFamily
· Pending
· 6 DOM
Cashflow @ list (25.0% down · 7.5%)
Estimated rent
$1,870/mo
Mortgage (P&I)
−$1,206
Tax + insurance
−$272
HOA
−$0
Vac / Maint / Mgmt
−$393
Net cashflow
$-1/mo
Annual
$-11/yr
Cap rate
6.29%
Cash-on-cash
-0.02%
DSCR
1.00
1% rule
0.81%
Cash to close
$64,400
Investor read
- This is a 3-bed/2.0-bath single-family listed at $230k.
- At list price, monthly cash flow is $-1 ($-11/yr) — negative.
- To cash-flow at today's rent, offer at most $230k (0.1% below list).
- To meet the 1% rule (rent ≥ 1% of price), the offer needs to be $187k (18.7% below list).
- Only 6 days on market — expect competitive offers; lowballing is unlikely to land.
- Recommended offer: $187k (18.7% below list) — sets the bar for 1% rule.
- In year one you build about $25k of equity ($2k loan paydown + $23k appreciation (10.0% local appreciation)).
- Location reads 68/100 on livability (#148 in GA) — a middle-class / working-renter tenant base. Strengths: cost of living A+, housing A+, crime A; Watch: schools F, amenities F, commute F.
- Bartow County (rural): math 33% / reading 34% proficiency, ranked #70 of 174 in GA (top 40%) — families likely to look elsewhere, expect single-tenant / working-renter base with shorter leases.
- Market conditions: 48 active listings in the ZIP; 1,618 units permitted in Bartow County in 2024 (265 in 5+ unit buildings).
- 6 sale attempts since 3y ago with the ask held roughly flat each time — persistent listings suggest the price (not the market) is what's stuck; bring a comps-based counter.
- At projected returns (10.0% appreciation + 3.0% rent growth), your $64k cash investment doubles in ~3 years — after that, you're playing with house money.
- By year 2, paydown + projected appreciation supports a ~$40k cash-out refi (75% LTV) — recoverable capital for the next deal without selling this one.
- Climate carrying-cost: moderate wildfire risk; extreme-heat days projected 6→15/yr by 2055 (HVAC capex compounding) — expect insurance premiums to compound above CPI over the hold.
- Cap rate 6.3% vs local median 3.3% in Fairmount — top-decile yield for the area; either an underpriced asset or a hidden risk that comps aren't pricing in. Stress-test before assuming the spread holds.
Questions for listing agent
- What do current leases actually rent for vs. the listed asking? Can we see a recent rent roll and the last 12 months of T-12 income?
- Is there a deadline driving the sale (1031 exchange, divorce, estate, relocation)? That informs how much negotiation room exists.
- Schools are F-rated, which usually means shorter tenancies and higher turnover. Who's the typical renter profile here, and what's been the actual vacancy rate?
- The area grade is low — what's the realistic commute time and amenity access for the typical tenant pool here? Any planned neighborhood developments (good or bad) we should know about?
- What's the average days-on-market for RENTAL listings here right now (not sales)? A rising rental-DOM trend means longer vacancies and softer asking-rent achievability than the comps imply.
- What's the recent tenant-quality profile in this submarket — average credit score on applications, eviction rate, late-payment / NSF rate, and stable-employment percentage? A property-management company in the area should have these aggregated.
- How much new for-sale + rental construction is in the pipeline within 1–3 miles? Heavy new supply typically softens prices + rents 12–24 months out; constrained supply supports both.
CashFlowRE · CFR-WT47RP6S7JM76R
· Data 3 weeks ago
cashflowre.app · 2026-05-29