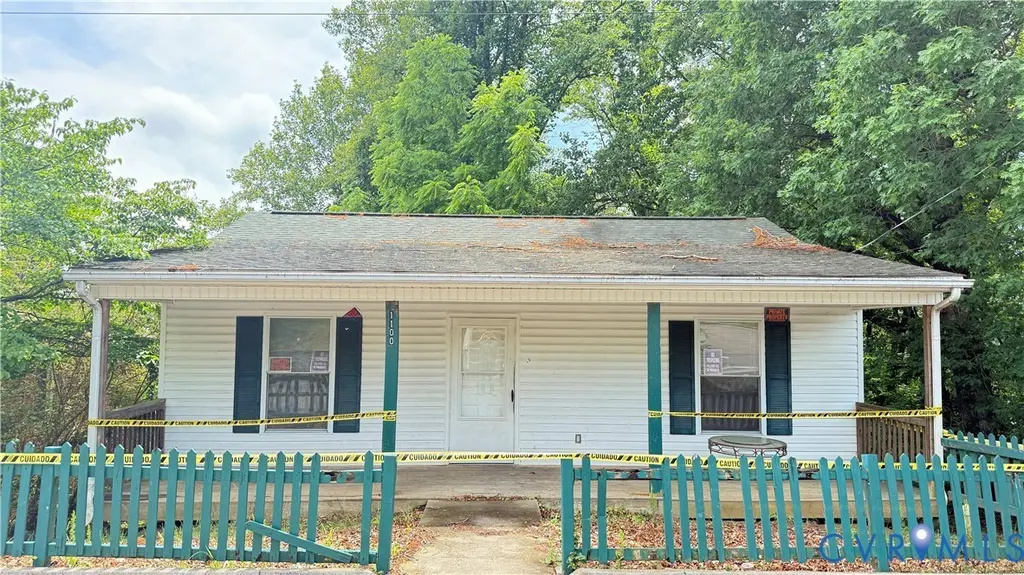
1100 Cherry St
Martinsville, VA 24112
$20,000D
2 bd · 1.0 ba ·
768 sqft ·
Built 2008
· Other
· Active
· 18 DOM
Cashflow @ list (25.0% down · 7.5%)
Estimated rent
$864/mo
Mortgage (P&I)
−$105
Tax + insurance
−$48
HOA
−$0
Vac / Maint / Mgmt
−$181
Net cashflow
$529/mo
Annual
$6,354/yr
Cap rate
38.06%
Cash-on-cash
113.46%
DSCR
6.05
1% rule
4.32%
Cash to close
$5,600
Investor read
- This is a 2-bed/1.0-bath other listed at $20k.
- At list price, monthly cash flow is $529 ($6k/yr) — positive.
- The deal already cash-flows at list — no discount required.
- Meets the 1% rule at list price ($864 rent vs $20k).
- It's been on market 18 days — a 2% lower offer ($20k) is reasonable based on typical stale-listing flexibility.
- Recommended offer: $20k (1.5% below list) — sets the bar for market timing.
- Local home prices are declining (-3.0%/yr); year-one equity from $138 of loan paydown is wiped out by about $600 of value loss. Plan a longer hold.
- Location reads 70/100 on livability (#231 in VA) — a middle-class / working-renter tenant base. Strengths: cost of living A+, health & safety A+, housing B; Watch: amenities F, commute F, employment D-.
- Martinsville City Public School District (town): math 29% / reading 53% proficiency, ranked #122 of 131 in VA (top 93%) — families likely to look elsewhere, expect single-tenant / working-renter base with shorter leases; 74% free/reduced lunch — lower-income household profile, screen leases tightly.
- Zoned schools: Patrick Henry Elementary (math 27% / reading 47%, grade F, #933 of 1,108 statewide, top 86%, 343 students, 100% FRL); Martinsville Middle (math 33% / reading 58%, grade D+, #268 of 342 statewide, top 80%, 393 students, 100% FRL); Martinsville High (math 32% / reading 72%, grade D+, #295 of 319 statewide, top 93%, 564 students, 101% FRL) — zoned schools average 100% FRL vs 74% district-wide (26 pts higher); higher-poverty schools than district average — tighter screening recommended.
- Market conditions: 258 active listings in the ZIP; 2 comparable units currently listed for rent nearby; 5 units permitted in Martinsville city in 2024 (5 in 5+ unit buildings).
- Martinsville County population projected at -14% by 2050 — secular population decline; favor cash flow + early exit over multi-decade hold.
- At projected returns (-3.0% appreciation + 3.0% rent growth), your $6k cash investment doubles in ~1 year — after that, you're playing with house money.
- Climate carrying-cost: extreme-heat days projected 7→17/yr by 2055 (HVAC capex compounding) — expect insurance premiums to compound above CPI over the hold.
- Cap rate 38.1% vs local median 5.8% in Martinsville — top-decile yield for the area; either an underpriced asset or a hidden risk that comps aren't pricing in. Stress-test before assuming the spread holds.
Questions for listing agent
- Is there a deadline driving the sale (1031 exchange, divorce, estate, relocation)? That informs how much negotiation room exists.
- Schools are B-rated — typically a magnet for longer-tenancy family renters. What's the average tenant stay here, and is there a school-zone premium baked into asking?
- The area grade is low — what's the realistic commute time and amenity access for the typical tenant pool here? Any planned neighborhood developments (good or bad) we should know about?
- What's the average days-on-market for RENTAL listings here right now (not sales)? A rising rental-DOM trend means longer vacancies and softer asking-rent achievability than the comps imply.
- What's the recent tenant-quality profile in this submarket — average credit score on applications, eviction rate, late-payment / NSF rate, and stable-employment percentage? A property-management company in the area should have these aggregated.
- How much new for-sale + rental construction is in the pipeline within 1–3 miles? Heavy new supply typically softens prices + rents 12–24 months out; constrained supply supports both.
CashFlowRE · CFR-WZ0V9D1R063X6Z
· Data 58 min ago
cashflowre.app · 2026-05-29