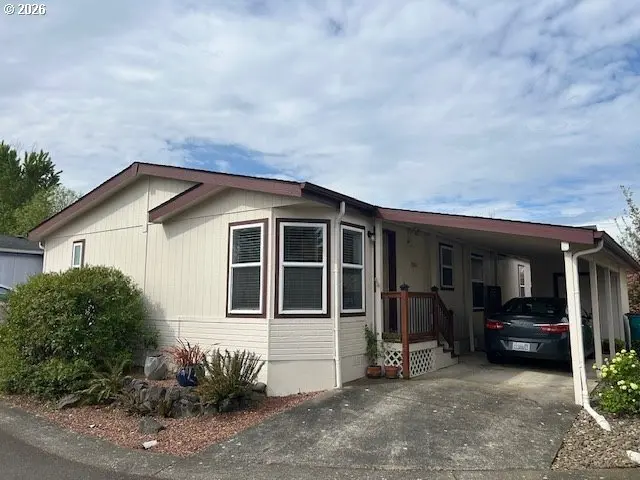
1805 NE 94th St
Hazel Dell, WA 98665
$159,500B-
3 bd · 2.0 ba ·
1,566 sqft ·
Built 1997
· Land
· Active
· 51 DOM
Cashflow @ list (25.0% down · 7.5%)
Estimated rent
$2,452/mo
Mortgage (P&I)
−$836
Tax + insurance
−$266
HOA
−$0
Vac / Maint / Mgmt
−$515
Net cashflow
$835/mo
Annual
$10,019/yr
Cap rate
12.57%
Cash-on-cash
22.43%
DSCR
2.00
1% rule
1.54%
Cash to close
$44,660
Investor read
- This is a 3-bed/2.0-bath land listed at $160k.
- At list price, monthly cash flow is $835 ($10k/yr) — positive.
- The deal already cash-flows at list — no discount required.
- Meets the 1% rule at list price ($2k rent vs $160k).
- It's been on market 51 days — a 3% lower offer ($155k) is reasonable based on typical stale-listing flexibility.
- Recommended offer: $155k (3.0% below list) — sets the bar for market timing.
- Local home prices are declining (-3.0%/yr); year-one equity from $1k of loan paydown is wiped out by about $5k of value loss. Plan a longer hold.
- Location reads 82/100 on livability (#67 in WA, #1,216 nationally) — a professional / high-income tenant draw. Strengths: amenities A+, commute A+, housing A+; Watch: crime D+, cost of living D.
- Vancouver School District (suburban): math 43% / reading 53% proficiency, ranked #156 of 291 in WA (top 54%) — families likely to look elsewhere, expect single-tenant / working-renter base with shorter leases.
- Zoned schools: Sarah J Anderson Elementary (660 students, 53% FRL); Gaiser Middle School (763 students, 69% FRL); Skyview High School (1,739 students, 33% FRL).
- Market conditions: Rents rising (+2.0%/yr); 188 active listings in the ZIP; 27 comparable units currently listed for rent nearby; rentals at typical pace (median 17d on market — plan ~3-4 weeks tenant-placement turnaround); solid renter incomes; 3,547 units permitted in Clark County in 2024 (1,361 in 5+ unit buildings).
- Clark County population projected at +29% by 2050 — long-run rental-demand tailwind backs the buy-and-hold thesis.
- 14 sale attempts since 20y ago with the ask held roughly flat each time — persistent listings suggest the price (not the market) is what's stuck; bring a comps-based counter.
- At projected returns (-3.0% appreciation + 2.0% rent growth), your $45k cash investment doubles in ~6 years — after that, you're playing with house money.
- Cap rate 12.6% vs local median 3.3% in Hazel Dell — top-decile yield for the area; either an underpriced asset or a hidden risk that comps aren't pricing in. Stress-test before assuming the spread holds.
- This rent runs 33% of the median local income ($89k/yr) — at the standard rent-burdened threshold; future hikes will face affordability resistance.
Questions for listing agent
- It's been on market 51 days. Have you received any prior offers? Is the seller open to a 3% concession, seller financing, or rate buy-down credit?
- Is there a deadline driving the sale (1031 exchange, divorce, estate, relocation)? That informs how much negotiation room exists.
- Schools are F-rated, which usually means shorter tenancies and higher turnover. Who's the typical renter profile here, and what's been the actual vacancy rate?
- Crime grade is D in this area — have there been break-ins, vandalism, or insurance claims at this property in the last 3 years? What carrier currently insures it and at what premium?
- What's the average days-on-market for RENTAL listings here right now (not sales)? A rising rental-DOM trend means longer vacancies and softer asking-rent achievability than the comps imply.
- What's the recent tenant-quality profile in this submarket — average credit score on applications, eviction rate, late-payment / NSF rate, and stable-employment percentage? A property-management company in the area should have these aggregated.
- How much new for-sale + rental construction is in the pipeline within 1–3 miles? Heavy new supply typically softens prices + rents 12–24 months out; constrained supply supports both.
CashFlowRE · CFR-WZ5S1EEA71SGQV
· Data 10 h ago
cashflowre.app · 2026-05-29