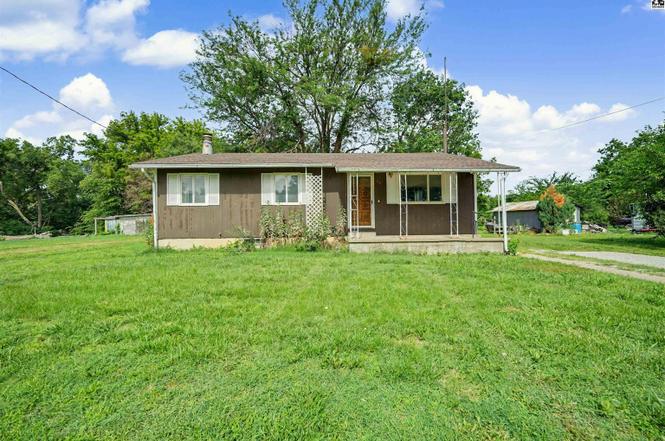
110 S Maud St
Marquette, KS 67464
$115,000D
3 bd · 2.0 ba ·
1,040 sqft ·
Built 1975
· SingleFamily
· Pending
· 1 DOM
Cashflow @ list (25.0% down · 7.5%)
Estimated rent
$965/mo
Mortgage (P&I)
−$603
Tax + insurance
−$182
HOA
−$0
Vac / Maint / Mgmt
−$203
Net cashflow
$-23/mo
Annual
$-272/yr
Cap rate
6.06%
Cash-on-cash
-0.85%
DSCR
0.96
1% rule
0.84%
Cash to close
$32,200
Investor read
- This is a 3-bed/2.0-bath single-family listed at $115k.
- At list price, monthly cash flow is $-23 ($-272/yr) — negative.
- To cash-flow at today's rent, offer at most $111k (3.5% below list).
- To meet the 1% rule (rent ≥ 1% of price), the offer needs to be $97k (16.1% below list).
- Only 1 days on market — expect competitive offers; lowballing is unlikely to land.
- Recommended offer: $97k (16.1% below list) — sets the bar for 1% rule.
- In year one you build about $2k of equity ($795 loan paydown + $2k appreciation (1.3% local appreciation)).
- Location reads 62/100 on livability (#371 in KS) — a middle-class / working-renter tenant base. Strengths: cost of living A+, housing A+, health & safety A+; Watch: crime F, amenities F, commute F.
- Smoky Valley (town): math 29% / reading 40% proficiency, ranked #58 of 169 in KS (top 34%) — families likely to look elsewhere, expect single-tenant / working-renter base with shorter leases; only 19% free/reduced lunch — higher-income household profile.
- Zoned schools: Soderstrom Elem (math 57% / reading 52%, grade C, #107 of 684 statewide, top 18%, 321 students, 35% FRL); Smoky Valley Middle School (math 23% / reading 37%, grade F, #64 of 219 statewide, top 32%, 246 students, 37% FRL); Smoky Valley High (math 12% / reading 32%, grade F, #165 of 327 statewide, top 55%, 253 students, 33% FRL) — zoned schools average 35% FRL vs 19% district-wide (16 pts higher); higher-poverty schools than district average — tighter screening recommended.
- Market conditions: 9 active listings in the ZIP; 102 units permitted in McPherson County in 2024 (0 in 5+ unit buildings).
- McPherson County population projected to shrink 6% by 2050 — rents likely to lag national; underwrite the cash flow, not the appreciation.
- 2 sale attempts with the ask held roughly flat each time — persistent listings suggest the price (not the market) is what's stuck; bring a comps-based counter.
- At projected returns (1.3% appreciation + 3.0% rent growth), your $32k cash investment doubles in ~10 years — after that, you're playing with house money.
- Climate carrying-cost: extreme-heat days projected 7→17/yr by 2055 (HVAC capex compounding) — expect insurance premiums to compound above CPI over the hold.
Questions for listing agent
- What do current leases actually rent for vs. the listed asking? Can we see a recent rent roll and the last 12 months of T-12 income?
- Built in 1975 — when were the roof, HVAC, electrical panel, plumbing, and water heater last replaced?
- Is there a deadline driving the sale (1031 exchange, divorce, estate, relocation)? That informs how much negotiation room exists.
- Schools are D-rated, which usually means shorter tenancies and higher turnover. Who's the typical renter profile here, and what's been the actual vacancy rate?
- Crime grade is F in this area — have there been break-ins, vandalism, or insurance claims at this property in the last 3 years? What carrier currently insures it and at what premium?
- The area grade is low — what's the realistic commute time and amenity access for the typical tenant pool here? Any planned neighborhood developments (good or bad) we should know about?
- What's the average days-on-market for RENTAL listings here right now (not sales)? A rising rental-DOM trend means longer vacancies and softer asking-rent achievability than the comps imply.
- What's the recent tenant-quality profile in this submarket — average credit score on applications, eviction rate, late-payment / NSF rate, and stable-employment percentage? A property-management company in the area should have these aggregated.
CashFlowRE · CFR-X1345P0SR8Q6T8
· Data 5 days ago
cashflowre.app · 2026-05-29